Data Mapping Files with XML Mixed Content


As more specialized data is adapted for delivery on demand to mobile devices with smaller screens, documents with complex structures can be a challenge. Fortunately, MapForce, Altova’s graphical data mapping, conversion, and integration tool, has special features to accelerate data integration projects of all sizes.

For example, richly-formatted documents may include XML mixed content, a complex datatype that permits an XML element to contain text, attributes, and other child elements. Common instances of XML mixed content include blocks of text with tags for bold or italic fonts, or tags that select terms for indexing or other special treatment. Documents with XML mixed content can be difficult to include in a data integration project, since they appear to be free-form and unpredictable, with child elements that occur in any order or even multiple times within the parent.

Mapping_mixed_content

Read more…

Tags: , ,

Manipulating Data in Cross-Platform Mobile Applications


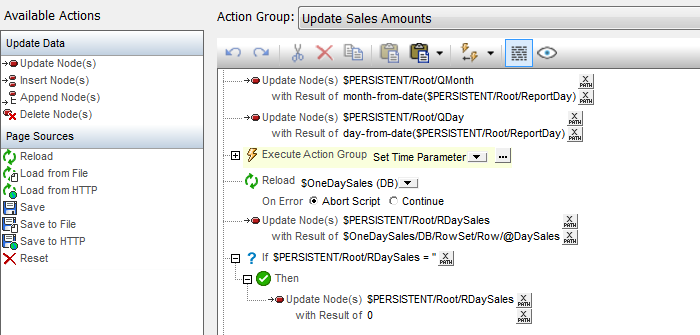
Altova MobileTogether empowers enterprises of any size to design and deploy custom mobile solutions that run on all mobile platforms. This post is part 2 of a discussion of the MobileTogether Actions Dialog that lets developers quickly create sophisticated event handlers, control flow, and operations that work the same on iOS®, Android™, Windows® Phone 8, and Windows 8 devices, as well as an HTML5 browser-based client, without worrying about the unique details of the API or SDK for each mobile operating system.

world population
(Click here if you missed part 1, titled Defining Event Handling and Control Flow for Cross-Platform Mobile Applications.)

This post covers some of the MobileTogether actions that manipulate data and are flexible, powerful, and accelerate building data-driven mobile enterprise apps to deliver up-to-the-minute information to busy users on the go.

image update 1
Read more…

Tags: , , ,

New Data Integration Whitepaper Now Available


The data engulfing enterprises today comes from many seemingly unrelated sources. Collecting, refining, and assimilating all this information, and being flexible enough to accept new data formats and resources, is critical to success in the 24/7 connected world.

We are proud to announce a new whitepaper titled Data Challenges and the MapForce Platform for Data Integration that addresses these issues, now available for free download from the Altova Reference Library.

Mapping_mixed_content


This data integration whitepaper gives business executives, data analysts, data-focused developers and others an overview of current trends and issues in data integration, then discusses how Altova MapForce combines with Altova Server products to create a highly automated enterprise data integration platform that is configurable, scalable, and cost-effective.

To cover all the relevant, up-to-date information, the whitepaper even includes a section titled Data Integration for Mobile Devices that discusses how Altova MobileTogether easily integrates to bring data integration results to mobile devices, providing business intelligence dashboards, elegant enterprise forms, and much more in today’s cross-platform BYOD (bring your own device) workplaces.

Click here to download your copy today!

The MapForce Platfrom for Data Integration whitepaper

Tags: , , , , ,

Data Integration for Mobile Devices – MobileTogether Works with FlowForce Server


When an offsite manager can read and reply to company email on a mobile phone, it’s only a short step to wanting access to all up-to-the-minute company data from the most convenient device.

Previously we’ve written about using FlowForce Server to generate HTML output that communicates data integration results. And yes, HTML results can be made available to Web browsers on mobile phones and tablets, but that’s an inferior solution for several reasons – the data will be cumbersome to view because it is not formatted for each device, and there is no interactive support for user interface controls built into mobile operating systems like buttons, combo boxes, edit fields, etc.

Fortunately, FlowForce Server jobs can be triggered by Altova MobileTogether solutions. The results are delivered directly to the mobile device and presented in a beautiful native-client form.

Altova MobileTogether is a unique cross-platform mobile development solution that includes functionality to work with FlowForce Server, and by extension MapForce Server, to bring data integration results to mobile devices to integrate business intelligence dashboards, elegant enterprise forms, and much more.

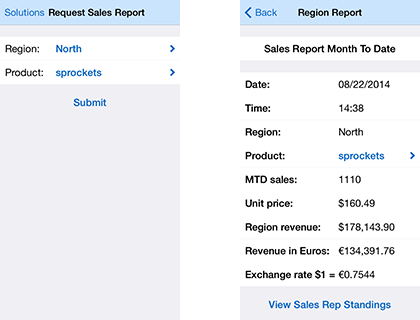
Here’s how a month-to-date sales report can appear on a mobile phone as a MobileTogether solution:

Month-to-date sales report on a mobile device, created with MobileTogether

When the solution launches, the sales manager selects the region and product, the report is generated by execution of the FlowForce Server job running on a server back in the enterprise data center, and the results are displayed.

Read more…

Tags: , , , ,

Automating Data Integration Workflows – Download the E-Book


We’ve published an e-book titled Automating Data Integration Workflows with Altova FlowForce Server that is now available for free download from the Altova Web site.

Here is a brief description: FlowForce Server is a highly-customizable platform to automate data transformations defined by MapForce data mappings, report and document generation, and other tasks on dedicated servers, virtual machines, or workstations scaled for the scope of the project. FlowForce Server empowers data architects, analysts, and other IT professionals to efficiently complete enterprise-level data integration tasks.

Automating Data Integration Workflows with Altova FlowForce Server provides an overview of the Altova FlowForce Server platform through a series of real-world data integration tasks and examples.

Automating Data Integration Workflows with Altova FlowForce Server

The new e-book collects updated information from the Altova Blog, the Altova Web site, and some all-new material, organized in one location to help new FlowForce Server users get started and to suggest new applications and efficiencies for experienced users.

Read more…

Tags: , , , , , ,

FlowForce Server Job Cache Enhancements


FlowForce Server has new enhancements that add functionality to job caching. Job caching allows administrators to schedule execution of time consuming jobs, store the results, and deliver output instantaneously in response to HTTP requests from end users. Our earlier post titled Result Caching Accelerates Application Response Time described how to configure a job to take advantage of caching.

151346252_700px

Read more…

Tags: ,

Deploy Data Mappings and Report Designs for Automated Processing


Deploying data mappings created in MapForce and report designs created in StyleVision for automated processing by Altova server products is straightforward and quick.

The File menu in MapForce includes two options to optimize, preprocess, and deploy data mappings for MapForce Server and FlowForce Server. Preprocessing enables faster performance and reduced memory footprint for most data mappings.MapForce menu option to deploy to FlowForce Server Read more…

Tags: , , , ,

XML Wildcard Data Mapping and Transformation in MapForce


MapForce 2014 now supports mapping of XML wildcards that create a designed-in extension mechanism for XML Schemas, implemented as <xs:any> or <xs:anyAttribute>.

Consider this XML fragment viewed in XMLSpy:

Fragment of an XML document following the GPX XML Schema

This small portion of a very long file shows two track points recorded during a road trip by a Garmin GPS device. The XML data follows the GPX XML Schema, with Garmin extensions to add speed and course heading values. XML wildcard mapping lets you map these extensions in MapForce just like any other elements explicitly defined in the XML Schema.

Let’s assume we want to read the .gpx file and extract the highest speed recorded for a trip:

Output of the completed mapping Read more…

Tags: , , ,

Result Caching Accelerates Application Response Time


Rapid response to user input is critical to the success of any Web application. FlowForce Server administrators can leverage result caching, a new feature introduced in version 2014, to deliver nearly instantaneous results to users running FlowForce Server jobs in a browser window as HTTP services.

A FlowForce Server job running as an HTTP service

Configuring a FlowForce Server job to take advantage of result caching is a simple two-step process. As an example, let’s look at the job we created recently in FlowForce Server Jobs as HTTP Services. We defined a StyleVision Server transformation as the last step in a FlowForce Server job and made the job available as an HTTP service that delivered the HTML result to a Web browser window. Read more…

Tags: , ,

FlowForce Server Jobs as HTTP Services


FlowForce Server administrators can define jobs as HTTP services to empower end users to execute the job on demand, as easily as opening a Web page.

A FlowForce Server job as an HTTP service with a URL

When a FlowForce Server job runs as an HTTP service results are delivered back to the Web browser. If the last step is a StyleVision Server transformation, the job can create a rich HTML-based Web page.

Even better, the same result is simultaneously saved in the enterprise workflow.
Read more…

Tags: ,

Use XPath Expressions to Refine Data Selection


In this era of big data we often need to simplify analysis and communication by creating customized views into sections of a larger file. XPath, short for XML Path Language, is designed to allow users to address parts of large XML documents. XMLSpy supports XPath with an XPath Analyzer window and in its interface for charting XML data, MapForce supports XPath functions for XML data mapping, and StyleVision supports XPath in conditional templates, extension templates, and template filtering.

faces-laptop

Read more…

Tags: , , , , ,

Filesystem Commands and More Wizardry with FlowForce Server Built-in Functions


In our earlier posts on FlowForce Server, we described jobs that execute MapForce Server for data transformations, StyleVision Server for report and document rendering, and RaptorXML Server for XML processing. In each scenario we also used built-in system functions to copy move, or delete files, as is often required in real-world workflows.

95662684_700px

In this post we’ll take a look at more of the built-in functions automatically installed in the FlowForce Server system container. You can use these commands as execution steps to automate the file housekeeping so often required in enterprise production.
Read more…

Tags: , , ,

Constant Quest for Efficiency


In last week’s blog post titled FlowForce Server Supports RaptorXML, we created a FlowForce Server job that defined a RaptorXML execution step to validate XML files, and we called that job as a step at the end of our job that processes camera GPS data, as a final check on the output. That was a quick way to demonstrate integration of FlowForce Server and RaptorXML Server, but for real-world production we would want to perform the same task more efficiently.

RaptorXML as an execution step in a FlowForce Server job

If we insert the RaptorXML validation function at the top of the job, right in front of the On error definition as shown above, we can apply the same error handling steps for failures of either the data mapping or the validation step. In other words, an error in any one of a series of steps before the On error definition forces the job to take the error path.
Read more…

Tags: , ,

Download Example Files for FlowForce Server, MapForce, and StyleVision


In response to an interested reader’s suggestion, the Altova MapForce mapping files and StyleVision stylesheet we deployed to FlowForce Server for the job described in the blog post Taming Bad Input Data with FlowForce Server are now available for download on the Altova Web site at www.altova.com/documents/AltovaBlogExampleFiles.zip

Altova MapForce and StyleVision sample files

Simply unzip the archive into a new folder and you’ll have all the data mappings, the stylesheet, and other supporting data files all in one place. A ReadMe file explains the contents. You can download fully functional free trials of Altova MissionKit and FlowForce Server at https://www.altova.com/download.html and implement and test FlowForce Server yourself.

Or, execute the data mappings in MapForce and the stylesheet in StyleVision to see how easy it is to extract meaningful information from the GPS data recorded by your own digital camera or GPS device. The example files in the download were also used in Web Service as a Look-Up Table to Refine GPS Data, XPath Enhances XML Reports, and others in our series on working with XML and Global Positioning Systems.

If you’re already an Altova MissionKit user, you can download these files with examples of Web services and user functions for MapForce, and XPath calculations and chart features for StyleVision, and add them to the extensive libraries of MapForce and StyleVision samples installed with Altova MissionKit tools.

Tags: , , , ,

Taming Bad Input Data with FlowForce Server


Whenever you accept data from an outside source you risk encountering errors. We have blogged about this phenomenon in the past in Expect the Unexpected – Altova MissionKit Solves a Number Format Mystery and in the series of posts on Processing the Groupon API.

Bad data in an input file can cause the data transformation step of a FlowForce Server job to fail. When a FlowForce Server Job fails, further execution steps will not be performed. FlowForce Server is designed this way to prevent an error in one job step from cascading into a series of additional invalid results. Happily, FlowForce Server also includes features to help you recover from errors and keep production flowing.

In this post we will further extend the data mapping and report rendering job described in Customizing a FlowForce Server Job to gracefully handle bad data in an input file.

FlowForce Server New Job Steps
Read more…

Tags: , , , , , ,

Customizing a FlowForce Server Job


In our earlier post titled Automate Data Mapping and Transformation with FlowForce Server, we created a job called SimpleMapAndTransform to automate data mapping with MapForce Server and creation of html reports by StyleVision Server. After the FlowForce Server job ran several times, we have accumulated many output files in the same folder we use to process input files, as well as temporary intermediate files in the workFiles folder, as seen in the image below.

FlowForce Server job execution log and working folders

In this post we will enhance the job to create more orderly results and remove unneeded temporary files.
Read more…

Tags: , , , ,

Automate Data Mapping and Transformation with FlowForce Server


Altova FlowForce Server, launched on April 29, 2013, includes numerous enhancements over earlier beta releases and one of the most exciting new features is the implementation of StyleVision Server. Now a FlowForce Server job can automate a complete data transformation workflow by executing MapForce Server for data mapping and pipelining results to StyleVision Server to render a variety of output formats.This post describes a straightforward FlowForce Server mapping and transformation job as illustrated in these messages from the FlowForce Server Log, with the most recent step at the top of the list:

FlowForce Server Job Log showing MapForce Server and StyleVision Server job steps

We’ll start with the GPS log files created by a digital camera. We wrote about these files last January in the post titled Process Multiple Input Files in a Single Data Mapping. We’ll use the mapping output with a StyleVision SPS stylesheet adapted from the XPath Enhances XML Reports post to produce a time and elevation report for each file.A FlowForce Server For-each job step repeats based on the result of an expression. We can use For-each to build a list of files in a folder, then repeat one or more steps for each file. Here is how it looks in the job configuration page:

FlowForce Server data mapping job step

The line labeled Execute function defines the mapping to be used by MapForce Server, and the input parameter {file} refers to each file in the list C:CameraGPSexample*.LOG.We can add an execution step to instruct StyleVision Server to perform the transformation:

FlowForce Server transformation job step

The data mapping creates output files by adding .gpx to the name of the input file, and now we can define the transformation input using the {file} variable with the new file suffix. We chose to create .html output, but we could just as easily create other formats for a multi-channel publishing implementation.The transformation working directory is the location where StyleVision Server unpacks the contents of the .pxf file containing the stylesheet, XML Schema, and other needed components. Using a dedicated working folder will keep the workflow more organized.We want to allow network users to drop new .LOG files into the C:CameraGPSexample folder and we want run the FlowForce Server job on a regular schedule, but we don’t want to process the same files over and over. We can define one more job step to move the processed file to a different location:

FlowForce Server file move job step

The complete FlowForce Server job is a series of three steps that loops for each .LOG file found in the folder. We can set up a repeating trigger for the workweek or any other appropriate schedule:

FlowForce Server calendar-based job trigger

Here is a portion of a .LOG file created by the camera that is an example of one input file:

.csv input file example

We can drop this file into the C:CameraGPSexample folder, where it will be processed based on the FlowForce Server job trigger:

Workflow folder structure

When the timer triggers execution of the FlowForce Server job, the Web interface Job Log page displays this series of messages for the complete job:

FlowForce Server job log for complete job execution

The contents of the C:CameraGPSexample folder now look like this:

Completed work files after FlowForce Server job execution

We can examine the 121130.LOG.gpx file in XMLSpy:

XML file created by MapForce Server job step

And we can open the .html file in any Web browser:

.html output from StyleVision Server job step

In future blog posts we will enhance this FlowForce Server example to illustrate jobs with error handling and more complete cleanup of working files.FlowForce Server is available for Windows, Linux, and soon for Mac OS platforms. To get started yourself, click here to download a free trial!

Tags: , , , , ,

New Server Products for Data Transformation


Altova Server ProductsOn the heels of our RaptorXML announcement earlier this month, we are very excited to tell you about the availability of three more new products that round out the Altova server software product family.

These high-performance server products are optimized for multi-CPU servers and are highly complementary when used together for defining and managing information pipelines. Cross-platform support is immediately available for Windows and Linux, with MacOS support expected just around the corner in May. Supported languages include English, German, Spanish, and Japanese.

Let’s take a look at each of these new products in detail.

FlowForce ServerAltova FlowForce Server

After receiving valuable customer feedback during the beta period, we have announced general availability of FlowForce Server, a powerful new tool for managing multi-step, enterprise-level data aggregation, processing, and reporting tasks. The straight-forward FlowForce Web browser interface makes it easy to configure and monitor jobs, whether they require a single step, or multiple cascading steps starting with data aggregation and conversion, and completing with multi-channel report generation.

FlowForce Server Job Log

A flexible and highly customizable system of job triggers lets you schedule FlowForce Server job execution based on each job’s unique requirements. Jobs can be triggered by date and time, by the arrival of files in hot folders, or by http command – and you can define multiple triggers per job. To take full advantage of server resources and meet the demands of busy data transformation workflows, multiple jobs – even multiple instances of the same job – can run simultaneously on FlowForce Server.
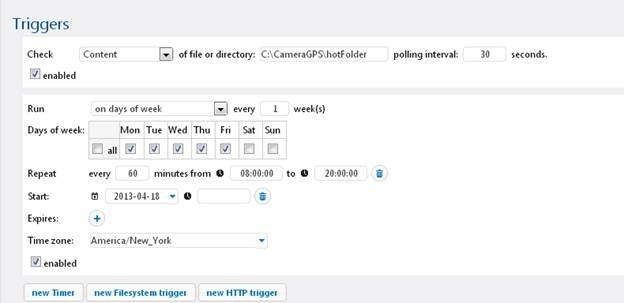
FlowForce Server Job Triggers

FlowForce Server provides strong security measures through user, role, job credential, and permission definitions that enable multiple simultaneous jobs while preventing unauthorized access to restricted data repositories or system resources.

So, what kind of jobs can you set up on FlowForce Server? Most customers will want to use it in conjunction with MapForce Server and/or StyleVision Server for high-performance automation of data integration and multichannel publishing projects that doesn’t require writing or compiling any source code.
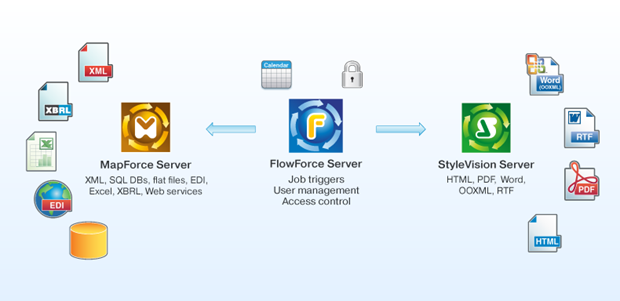
FlowForce Server enterprise workflow

MapForce ServerAltova MapForce Server

You may already be familiar with MapForce, Altova’s desktop developer software for aggregating, mapping, and converting data. We describe it as an any-to-any data mapping tool because it lets you move between any combination of XML, SQL database, flat file, EDI, Excel, XBRL, and Web services data. With the introduction of MapForce Server, it’s now easy to fully automate those transformations that have been defined in MapForce.

MapForce Server performs data transformations based on preprocessed and optimized data mappings stored in MapForce Server Execution files prepared by MapForce and uploaded over a network. Preprocessing enables faster performance and reduced memory footprint for most data mappings.

When operating under the management of FlowForce Server, MapForce Server is a powerful transformation engine suitable for the high-volume, quick turn-around demands of today’s leading edge data centers. The standalone version is suitable in a department level or other small environment that does not require the extensive multi-tasking, job scheduling, and security features of FlowForce Server.

StyleVision ServerAltova StyleVision Server

StyleVision Server provides high-performance automation of report and document generation tasks based on templates designed in Altova StyleVision. A graphical XSLT stylesheet and report design tool, StyleVision helps you create one design to render XML and XBRL data in Web and print formats including HTML, Word, RTF, and PDF, simultaneously. Using StyleVision Server, you can generate reports from XML and XBRL data on a recurring basis faster than ever before.

Like MapForce Server, StyleVision Server is an important option for document production by FlowForce Server, and the standalone version can be run from the command line and is suitable in smaller deployments that may not require all the features of FlowForce Server.

This new line of Altova server products represents a huge leap forward in effective automation of essential business processes, whether they require a single step, or multiple cascading steps starting with data aggregation and conversion via MapForce Server and completing with multi-channel report generation via StyleVision Server. These high performance workflow servers help customers design information pipelines quickly and easily, and then deploy them in a flexible way, utilizing the power and speed afforded by multi CPU servers. We’re excited to offer this new family of server products to our customers developing data integration and reporting projects using Altova MissionKit developer tools, as well as welcoming new customers who need a multi-platform, lightning fast orchestration engine.

Download a free fully-functional 30-day trial!

As with all Altova tools, we invite you to try these new server products before making a purchasing decision. Download a free, 30-day trial now!

Tags: , ,

Automate Data Transformation with FlowForce Server


Altova designed FlowForce Server to provide comprehensive automation, management, and control over data transformations performed by dedicated high-speed servers. FlowForce Server Beta 3 is currently available to users of MapForce Enterprise and Professional Editions at no charge during the beta test period.FlowForce Server can provide hot folder automation of data mappings and maintains a detailed activity log users can monitor remotely in a Web browser window. The screenshot below shows the log for FlowForce Server running the MapForce data mapping CameraLogToGPX we wrote about in the blog post titled Process Multiple Input Files in a Single Data Mapping. This mapping used wildcards to specify multiple input files for processing.
FlowForce Server job log

It only takes a few minutes to set up, run, and review the results of jobs like this on FlowForce Server. Wildcards or Hot Folders?Wildcards and hot folders increase the complexity of a data transformation workflow, and using them successfully requires careful planning. Let’s take a minute to look a little deeper at the scenario we want to implement.Assume we are the IT department in a company that publishes nature and hiking guides. We employ photographers who go out trekking and record their routes as they go, using the GPS tracking feature of their digital cameras. We want to convert the camera GPS log files to XML-based .gpx format for mapping and other processing.We will publish a folder on our network where photographers can drop off their GPS log files. This will be the hot folder FlowForce Server watches for new files to supply as input to the CameraLogToGPX mapping. We only need to process each input file once. So, after the data transformation is complete, we can remove the input file from the hot folder. We also want to place the output file in a separate folder. This suggests the following FlowForce Server job steps:

  • Look in the hot folder to see if new a input files has arrived
  • Perform the data mapping on the input file and place the output file in a separate folder
  • Move the input file to a permanent location

The diagram below shows a folder structure we can use for the workflow, with files ready to drop into the hot folder for processing:

Hot folder structure

The hot folder is C:CameraGPShotFolder and the generated .gpx files will be placed in C:CameraGPSoutputFiles. When the data mapping is done, input files will be moved to C:CameraGPScompletedInput. Deploy the Mapping on a ServerMapForce Beta is a component of FlowForce Server that works just like MapForce, and adds a feature to deploy mapping files to a FlowForce Server. Existing data mappings need little or no special preparation for deployment.The only thing we need to think about are the filenames of the input and output files. We will instruct FlowForce Server to provide the input filename as a job parameter as new files arrive in the hot folder for processing. The original mapping assigned a wildcard filename for the input component, which is no longer needed. We will also want FlowForce to specify the location of the output file.We can open the mapping in MapForce Beta, remove the filename from the input component, and add a remove-folder filepath function to the output file so FlowForce Server can set the destination. The screenshot below shows the new filename definitions in the mapping.

Mapping file names

In the MapForce Beta dialog to deploy the mapping, we can choose to immediately open the mapping in a FlowForce Server job definition window in a Web browser to finish defining the job operations.

Deploy mapping dialog

Defining the Job in FlowForce ServerThe screenshot below shows the complete job steps defined in a FlowForce Server job properties window:

FlowForce Server job definition

The job trigger is defined at the bottom of the window. Every 30 seconds, FlowForce Server will check the hot folder. If the contents have changed, FlowForce Server will execute the job steps. Each Execution step could be a deployed MapForce mapping, a system step, or even another FlowForce Server job.The name of each new file entering the hot folder becomes the parameter called {triggerfile} that we use in the mapping step as the input filename, and in the move step as the name of the file to be moved.The Working-directory parameter in the mapping step defines where the output files will be placed.FlowForce Server also includes features to set automatic run and stop times for jobs, user permissions and roles, and Queue settings to define minimum time between job runs and maximum parallel instances of a job.In our scenario, we are likely to receive multiple input files in groups as they are copied from photographers’ memory cards. Multiple parallel runs can greatly improve throughput. As a rule of thumb, you might want to match the number of cores or CPUs in the machine running FlowForce Server.

FlowForce Server job queue settings

Exploring the Job Log

Each time FlowForce Server runs our job, six lines are added to the Log View shown in the illustration at the top of this post. The first and last lines record the start and completion of the job, and each Execution step generated its own start and completion messages. The phrase “completed with status: 0” means the step was successful with no errors.

FlowForce job log

We can click the more links for a detailed report on each Execution step. The screenshot below shows the message for the MapForce mapping Execution step:

FlowForce job detail

Each file dropped into the hot folder generates an individual FlowForce Server job instance, even if multiple files are added as a group. This makes it easy to track any individual input file that generates an error.When we dropped four files into the hot folder, FlowForce Server ran four jobs, and the contents of the output folder looked like this:

Job results folder

Click here to read more about FlowForce Server Beta 3 at the Altova Web site, or visit the FlowForce Server Beta 3 download page to get started automating data transformations in your data center!

Tags: , ,

Process Multiple Input Files in a Single Data Mapping


Typical data conversion tasks require processing numerous input files that arrive in batches. Altova MapForce includes features that let you handle groups of files with minimal intervention.For instance, we recently copied a set of files from the memory card of a digital camera with GPS support. Each .LOG file is a CSV containing GPS coordinates for a single route.

Directory list of source files for data conversion

We quickly designed a mapping to convert the CSV data to XML-based .gpx format and processed all three files to generate three output files in a single execution:

List of automatically generated output files

Read more…

Tags: ,

Stored Procedures in Database Mappings


In response to user requests, the new release of MapForce 2013 includes robust support for stored procedures in database mappings as:

  • input components (for stored procedures that provide results)
  • output components (for stored procedures that insert or update data in a database)
  • or, stored procedures may be inserted as a function-like call (allowing users to provide input data, execute the stored procedure, and read/map the output data to other components)

The screenshot below shows the mapping of a stored procedure in SQL Server to create an XML file.

A MapForce database mapping with a stored procedure

Read more…

Tags: , ,

Web Service as a Look-Up Table to Refine GPS Data


Elevation data recorded by GPS devices is notoriously inaccurate, especially in hilly terrain like the Russian River Valley example from our earlier post.

The final elevation track plotted from the Russian River Valley GPX file is suspicious for several reasons. First, the graph shows we descended almost 50 feet below sea level. That’s hard to believe, since we were travelling along the bank of the river, only about 10 miles from the Pacific Ocean.

Altova StyleVision ChartSecondly, we were headed mostly west, following the river downstream, but the track shows a predominantly uphill trend.
We can evaluate the recorded GPS elevation data by comparing it to information available from the United States Geological Survey (USGS). The USGS operates a Web service that accepts latitude and longitude coordinates, and returns elevation data measured by NASA and assessed for accuracy based on over 13,000 control points in the continental United States.

Using the elevation Web service in an Altova MapForce mapping will let us extract each point from the GPX file, send the coordinates to the USGS Web service, and build a new GPX file with corrected elevation data.

Read more…

Tags: , , , , , , , , ,

New Case Study: Automating XBRL Data Collection and Processing


Case studies are a great way to see how other organizations use Altova® technologies to develop unique projects that meet their business goals. We’re often asked, however, what comes next. Did the project take off? Has it grown since the case study was published?

We’re happy to bring you a follow up to a case study we published last year about the not-for-profit Maryland Association of Certified Public Accountants (MACPA).
In the original case study, MACPA converted General Ledger and other financial data from siloed systems into XBRL – in house and on a budget – with the Altova MissionKit®. At that point, they were mapping the XBRL file to multiple external targets, including an Excel spreadsheet used to feed their Key Performance Indicators (KPI) system. (You can read the original XBRL case study here.)

Since that time, they’ve built on the foundation they created and developed a business intelligence dashboard driven by the XBRL files they generate in MapForce®. They used Altova FlowForce®, an application designed to automate the execution of MapForce data transformations and other tasks on servers, virtual machines, and workstations, to automate the XBRL data collection and processing. Now the most recent data is available across the entire organization for custom reporting.

You can read the follow-up to the original XBRL case study here.

clip_image001

Read more about how they did it. Read more…

Tags: ,

Resist Data Integration Redundancy


The Internet makes massive amounts of data available for lots of interesting applications. But whenever you design a unique analysis and presentation of information you don’t privately control, you risk that the owner will offer the same view at some point in the future, instantly making your application redundant.

That’s exactly what happened to the Groupon API data-mining project we originally wrote about in August, 2011. Fortunately, the core of our project is a MapForce graphical data mapping. We can quickly and easily tweak the mapping and repurpose it to present an entirely different data set that provides new value.

HTML output from MapForce and StyleVision

Read more…

Tags: , , ,

Data Exchange for the Mobile Workforce


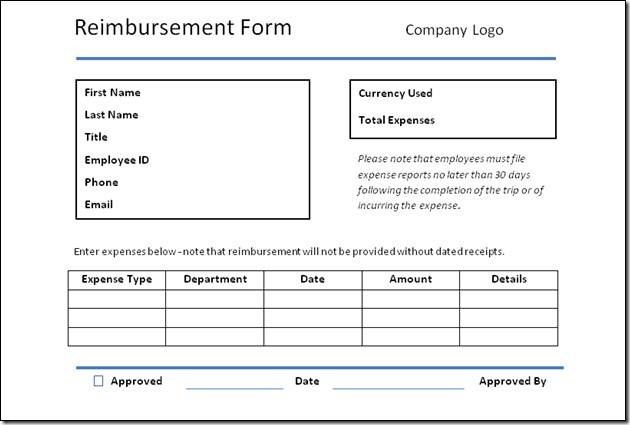
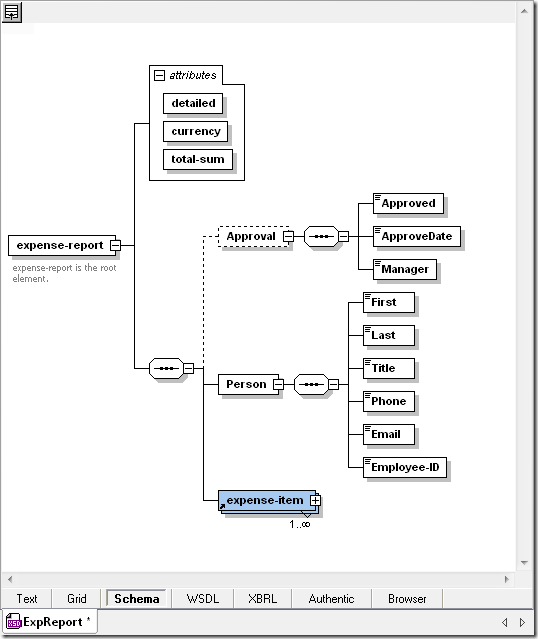
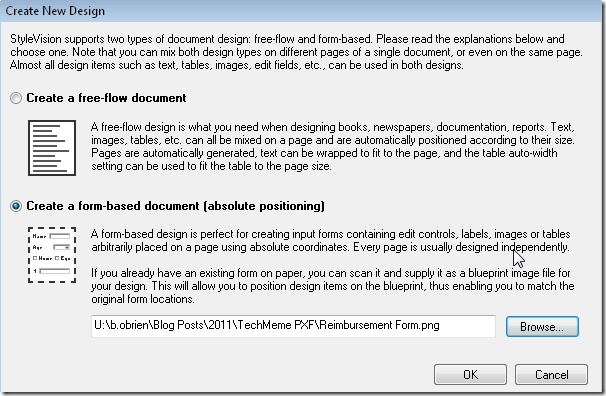
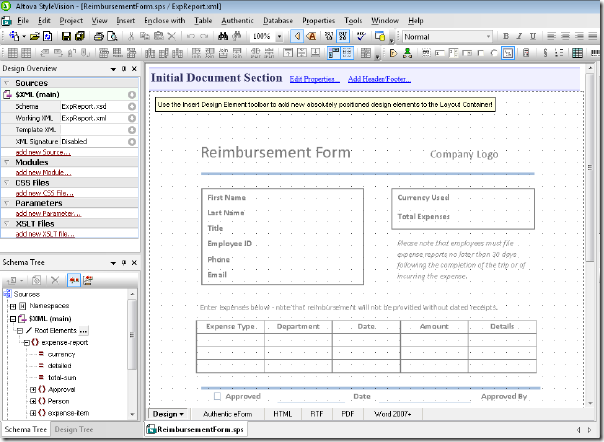
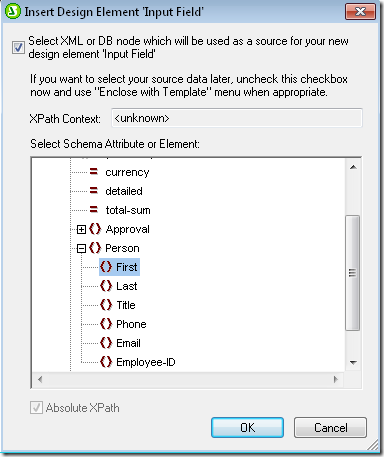
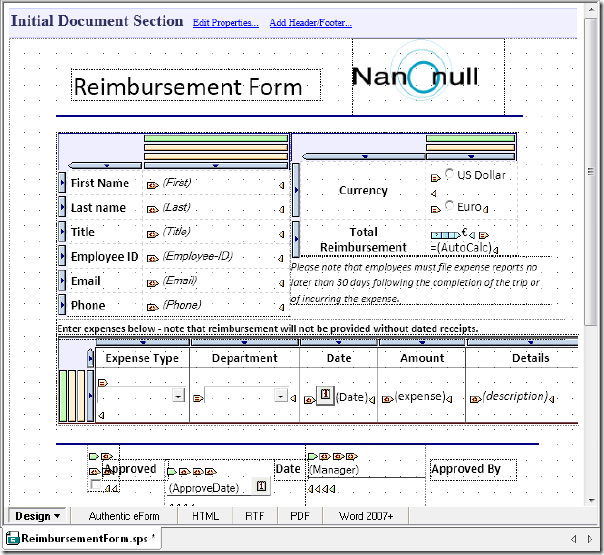
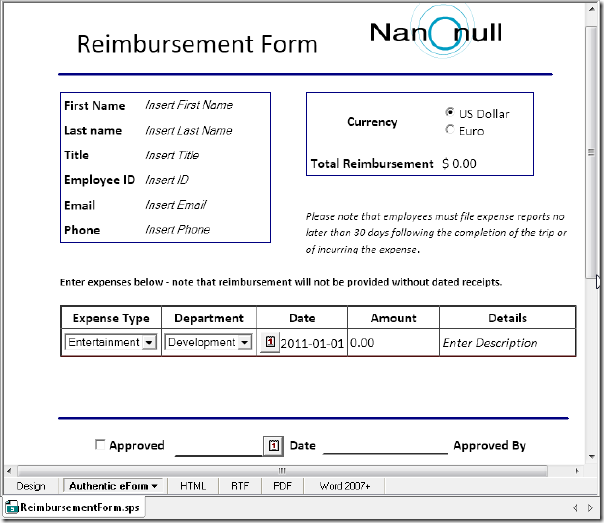
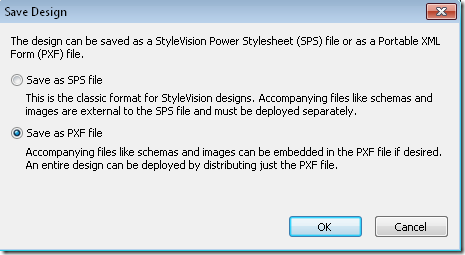
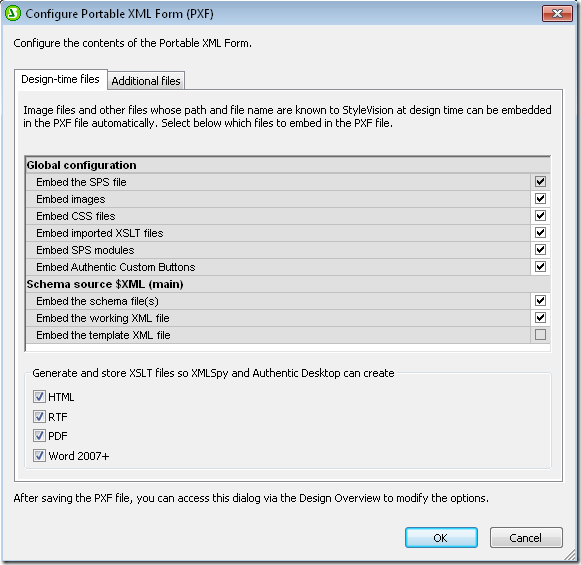
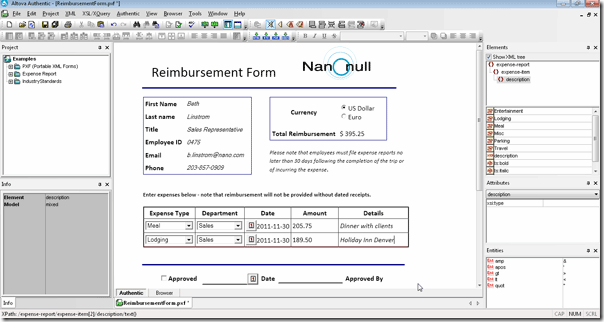
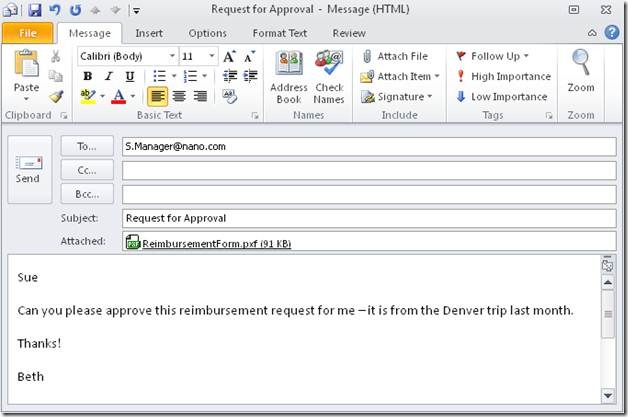
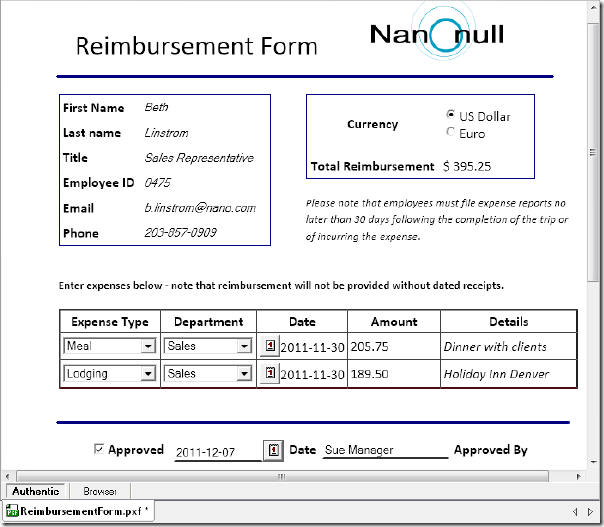
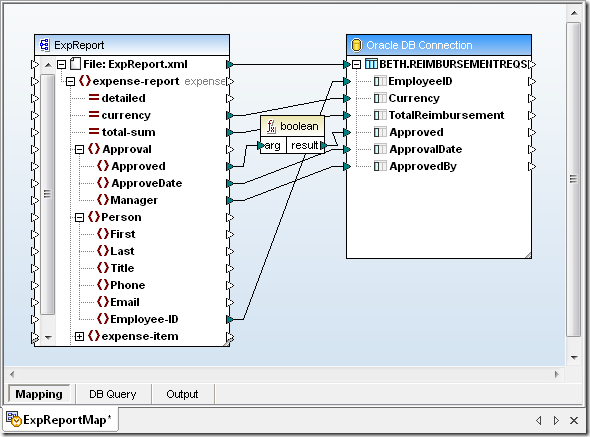
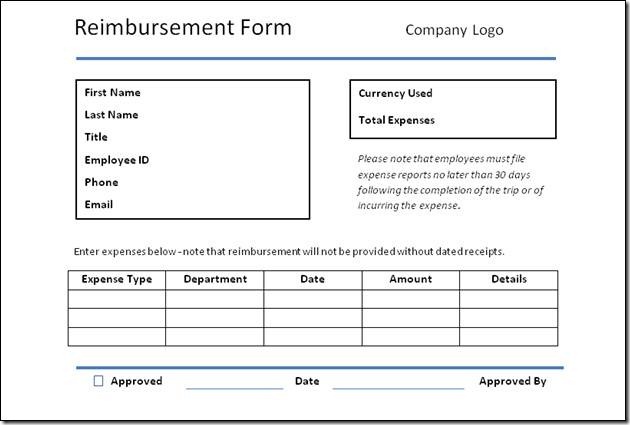
Data Exchange for the Mobile WorkforceOrganizations have been forced to adapt many of their internal business processes to accommodate an increasingly mobile workforce. Although there are technological solutions that address many of today’s communication needs, the plethora of different document formats in use – even within the same organization – means that some tasks remain vexing. For example, how does an organization remain flexible enough to facilitate the exchange of data among mobile workers yet retain the ability to bring that data into internal IT systems? Altova offers an inexpensive solution with StyleVision®, a graphical stylesheet and report designer with electronic forms capability, and Authentic®, a WYSIWYG XML and database editor in which end users can view and edit electronic forms created in StyleVision. The Authentic Community Edition is available from the Altova Web site as a free download so that anyone can be brought into your workflow, whether they are internal or external to your organization.clip_image002In this post we’ll present a sample case showing you how to create an electronic form that mirrors an existing paper form (in our example it is a reimbursement form) and then we’ll follow it as it makes its way around a fictional organization. Please note that the example we use here is simplistic and was designed only to illustrate the process of developing and deploying an electronic form. Although you can add additional data sources and perform validation and other complex functions in StyleVision, we have not illustrated these here.It is extremely easy to design electronic forms in StyleVision. To start, we simply select New – New from XML Schema/DTD/XML … from the File menu, browse to an XML Schema file, and select the type of design we’d like to create. For this example we created an XML Schema and instance file in XMLSpy, Altova’s XML editor and development environment, based on the fields on the paper reimbursement form. You can also base a StyleVision design on a database or XBRL taxonomy.Below is a copy of the reimbursement form we will be using along with the XML Schema we created.clip_image002clip_image003Once we select the XML file in StyleVision, we are prompted to select either a free-flow or form-based document. In a form-based document all design elements (e.g., text boxes for user input, images, buttons) are fixed in position – ideal for data entry forms.When we create a form-based document, we can upload a “blueprint image” so that we can recreate a paper-based form exactly as it was originally designed. This is the option we’ve selected below. The image will appear in the background of the design window and we will simply place design elements on top of corresponding elements on the form. Of course, the blueprint image overlay does not appear in the final output.clip_image004The screenshot below shows the blueprint image as it appears in the design window in StyleVision – how cool is that? clip_image005Now, using the Insert menu at the top, we can simply insert design elements onto the blueprint image in the design window.Available design elements include form controls (e.g., input boxes, combo boxes, radio buttons), images, tables, charts, and “layout containers” for exact positioning.We’ll start by adding input fields to capture employee information (i.e., First [Name], Last [Name], Title, etc. from the top part of the form). Once we click Insert – Insert Form Controls and select Input Field, the Insert Design Element dialog box appears.We have highlighted the First [Name] element in the dialog box below – the input field will now be associated with the First element. This way, when the end user types data into the input field and saves the form, this information will populate the First [Name] element in the XML file.clip_image006We now add design elements throughout the rest of the form, associating input fields with their respective elements from the XML file.When we are finished adding input fields, a logo, lines, a table for the expense items, and labels, the design looks like this – we’ve set the opacity attribute for the blueprint image to 0 to make it easier to view the design elements. Please note also that we’ve done some additional design work such as adding calendars in date fields, drop down boxes, and a currency sign that changes according to user input. For more information about fine tuning your form please see the StyleVision User and Reference Manual in the StyleVision application.clip_image007We can preview how the end user will see the form we designed in StyleVision by clicking on the Authentic eForm tab at the bottom of the design window (below). Note that the end user is prompted to enter data directly into each data input field. We accomplished this by placing the prompts (e.g., Insert First Name) in between the relevant tags in the XML file associated with our design. The end user simply highlights the prompt and replaces it with text.clip_image008Once we are finished designing the reimbursement form we can save the entire design – including the XML Schema and instance files, images, and any other associated files – in a single PXF® (Portable XML Form®). Saving the design as a PXF will enable us to email the form along with data updated in the underlying XML form among people both inside and outside the company’s LAN.clip_image009Once we hit OK we are prompted to select the files to include in the PXF. Notice that we’ve selected HTML, RTF, PDF, and Word 2007+ under the Generate and store XSLT files … heading. This will allow an end user to generate the form – with data – in these formats directly from Authentic.clip_image010Now that we’ve saved it in a PXF, the electronic form we designed in StyleVision is ready to be deployed in a business environment.In our example, we have a team of salespeople working across the globe who need to request reimbursement for business and travel expenses incurred. The salespeople complete expense reports, forward them to their managers for approval, and then send approved reports to the corporate office so that the information can be added into the accounting system.The PXF makes this easy.Once a salesperson is ready to complete a reimbursement request, she simply opens the PXF in Authentic and can immediately begin entering information onto the form. Below is a screenshot of a reimbursement form that has been completed in Authentic – notice that the form still needs a manager’s signature.clip_image011Now the salesperson must send it to her manager for approval. It’s easy to initiate an email with the form attached directly from Authentic. clip_image013Once the manager receives the email, she can simply double click the attachment and it will open in Authentic. Here the manager has clicked the Approved check box and added her name and the date.clip_image014The manager can then email the updated PXF back to the salesperson, who in turn emails it to the corporate office so it can be imported into the accounting system for processing. Our fictitious corporate office of course receives hundreds of reimbursement requests each day and has established a process for importing them into the relevant Oracle databases in the accounting system.We’ll use Altova MapForce, a graphical any-to-any data mapping, conversion, and transformation tool, to populate the corporate database with the data from the quotations. After setting up the mapping, we’ll automatically generate code from MapForce so that we can automate the transformation either through batch processing or a real-time conversion.First we’ll set up the mapping.We’ve inserted the XML file ExpRpt which we’ve extracted from the PXF into the left side of the MapForce design window and then inserted the Oracle database on the right side of the design window.Now we can drag and drop fields from the XML file with the reimbursement data into the Oracle database. We can also transform data, as we’ve done with the Approved element. Here we’ve used the built-in boolean function to convert the string value stored in the XML file (“true” or “false”) into the numeric equivalents (1 or 0). We can also create our own functions.The mapping we’ve created appears below.clip_image015Please note that this post offers a very broad overview of how to use both StyleVision and MapForce. Please visit the online training section of the Altova website for more in-depth instructions on how to use these and other Altova products.And there you have it. With the PXF, the fictitious Nanonull Corporation allows a group of far flung sales reps and their managers to easily exchange and edit information via electronic form. The PXF also provides a way for Nanonull to populate the accounting database without offering these employees direct access to company IT systems. All without busting the IT budget.

clip_image016

What could your organization do with a flexible, portable interactive document? Please share your ideas with other users by commenting on this blog post. Have you used StyleVision or other Altova products in an interesting project and think it would make a great case study? Email us at marketing@altova.com. We’d love to hear from you!

Tags: , , ,

XML Development with Database Integration


Did you know that XMLSpy connects to relational databases? One of the most compelling features of the Altova MissionKit is that numerous tools in the suite include offer deep integration with relational databases, providing seamless access to back end data for bi-directional conversion, integration, analysis, and reporting. image Let’s take a look at what you can do when you connect XMLSpy to your databases. Other database-enabled MissionKit tools will be covered in subsequent posts.All popular relational databases are supported in XMLSpy:

  • Microsoft® SQL Server® 2000, 2005, 2008
  • IBM DB2® 8, 9
  • Oracle® 9i, 10g, 11g
  • Sybase® 12
  • MySQL® 4, 5
  • PostgreSQL 8
  • Microsoft Access 2003, 2007

First step: Connect to and query the database

When you select Query Database from the DB menu, XMLSpy helps you connect to your database with the step-by-step Database Connection Wizard. Then, the DB Query window makes it easy to explore and/or edit data in the database you’re working with, either by opening existing SQL files or creating SQL scripts from scratch using drag-and-drop and auto-complete functionality. Once you execute your query, you can edit the database data in the results window, review changed fields (highlighted in pink), and commit the changes back to the database. Querying a database in XMLSpy

Next: Convert between XML and databases

Another common requirement is converting between XML and database models, and XMLSpy supports this in both directions. You can easily export database data to XML. If no schema is required, you can simply export the data to XML in its basic tabular format. Or, you can use the Create XML Schema from DB Structure option first, then import database data maintaining all the relationships and dependencies defined in the content model. Numerous options are available to specify the format of the schema, whether columns should be imported as elements or attributes, and the database constraints that should be generated in the XML Schema. Get schema from DB data Or, to go in the other direction, it’s just as easy to go from XML to a relational model in XMLSpy. The Export to Database dialog (accessed via the Convert menu) allows you to specify where to start the export, how to handle export fields, and which elements to include. Then, the data is instantly converted and stored in your database. image For times when you want to define a database with the same rules as an existing XML Schema, the Create DB Structure from XML Schema dialog lets you do so with numerous options. Any identity constraints included in the schema will automatically transfer to the database structure. Alternatively, it’s easy to define relationships between elements manually. Learn more about all these features for working with XML and databases in XMLSpy, or check out all the database tools available in the MissionKit.
Tags: , , ,

Leverage Your Financial Data with the XBRL Chart Wizard–Part 1


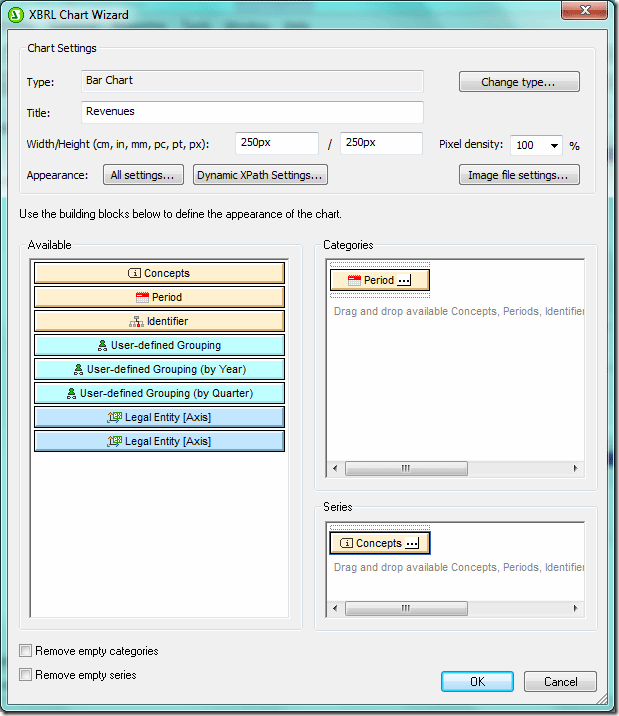
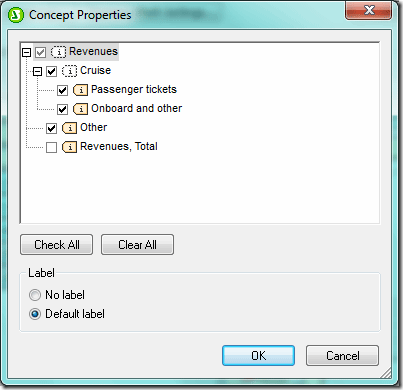
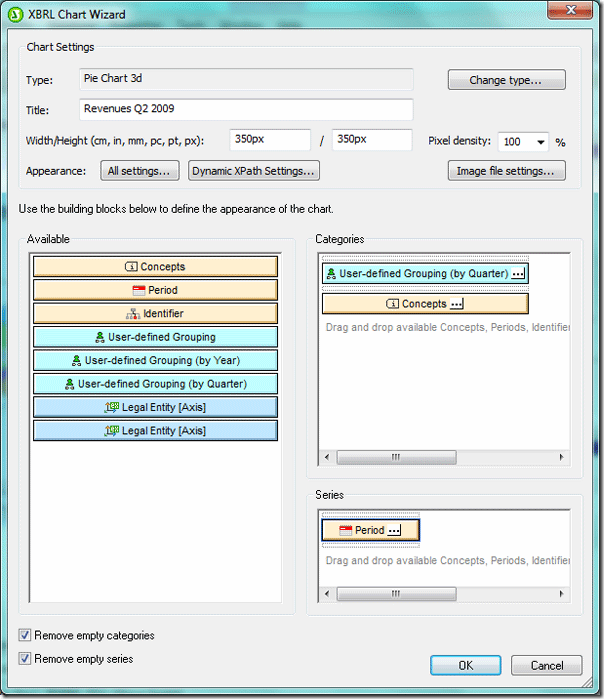
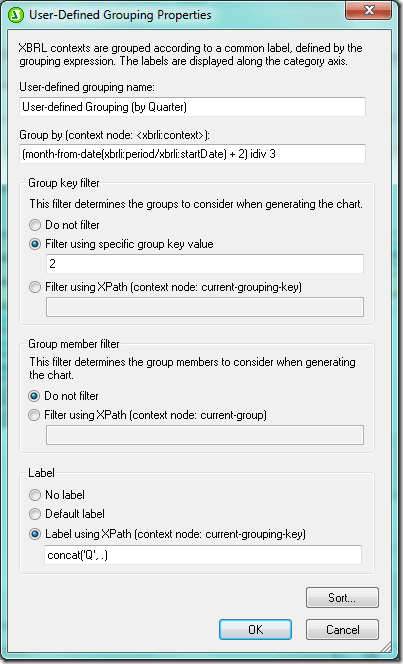
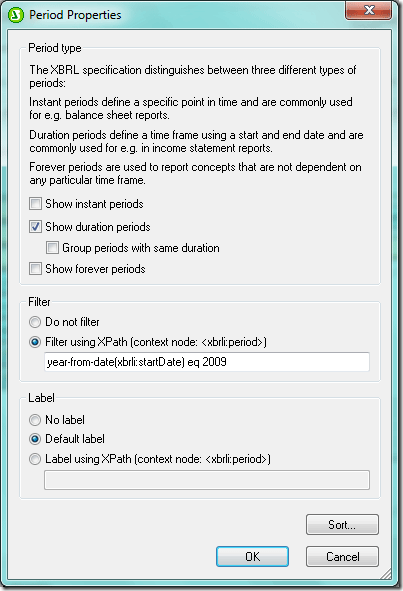
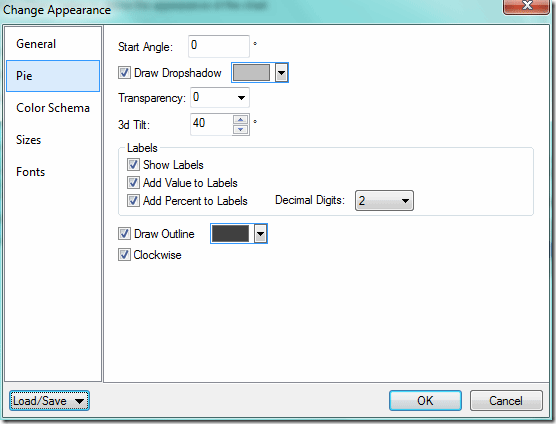
Extensible Business Reporting Language (XBRL), an XML-based language for financial data, is increasingly being used by both public and private organizations across the globe – in fact it is mandated for some companies in countries including the United Kingdom and the United States. Altova provides comprehensive support for XBRL tagging and XBRL reporting with the MissionKit, a suite of our most popular software. Among the MissionKit tools is StyleVision, a graphical stylesheet designer and report builder, which can be used to support a host of internal reporting and analysis activities for companies that use XBRL. clip_image001 In the next post we’ll focus on StyleVision’s XBRL Chart Wizard, a powerful XBRL visualization tool that can turn your XBRL-tagged financial data into powerful charts and graphs – if a picture is worth 1,000 words then StyleVision is worth its weight in gold. Calling the XBRL Chart Wizard You invoke the XBRL Chart Wizard as you do the XBRL Table Wizard and other StyleVision capabilities. Once you’ve started a design by selecting New – New from XBRL Taxonomy from the File menu and selected a taxonomy and working XBRL file, all concepts are populated to the Schema Tree. From here you simply select a concept from the XBRL taxonomy in the Schema Tree and drag it into the design window. For this example we’ll be using the Carnival Corporation quarterly report for 2009 that they have published with the SEC, but you can apply the same techniques to any XBRL instance document – be it a publicly available filing with the SEC or an internally generated XBRL file. As a first step, we will look at how the revenues are composed by creating a pie chart that shows the revenue breakdown. Here we’ve dragged the Revenues concept (highlighted in the Schema Tree in the left sidebar) into the design window and selected Create XBRL Chart.   clip_image003   Once you select Create XBRL Chart the XBRL Chart Wizard dialog box will open automatically.   clip_image004   Once you click the ellipses in the corner of the Concepts tab in the Series pane, the Concept Properties dialog box (below) will open and you can select concepts to appear in the chart. Carnival Corp breaks out revenues for their cruises between Passenger tickets and the Onboard and other. We will select those two concepts, and also the Other category to capture all elements that make up the total revenues.   clip_image005 Pie Charts Pie charts are useful when you wish to see the relative contribution of individual elements to the whole. Placing Onboard and other, Other Sales Revenue Net, and Passenger Tickets in a pie chart provides us with a visual representation of the relative contributions of each source of income to total revenue. We are now ready to make changes in the XBRL Chart Wizard dialog box so that our pie chart reflects the information we need in a format conducive to strategic decision making. First we must change the chart type under Chart Settings from Bar Chart to Pie Chart 3D via the Change type… button, which brings up the Change Type dialog box (below).   clip_image006   In pie charts, the concepts that will form the segments of the pie (in this instance the Onboard and other, Other Sales Revenue Net, and Passenger Tickets concepts that we selected above) are placed in the Categories pane and the values in the Series pane. Therefore we will need to move the Concepts tab to the Categories pane and the Period tab to the Series pane. We’d like to segment the revenue data from the XBRL file based on quarter. We do this by dragging the User-Defined Grouping (by Quarter) tab from the Available pane to the Categories pane. We’ll make the necessary changes in this tab in the next step. We will also check the Remove empty categories and Remove empty series boxes so that a value or label will not be generated if no data exists and change the size of the chart to 350 pixels x 350 pixels in the Chart Settings section of the XBRL Chart Wizard dialog box. After we make these changes, the dialog box looks like this:   clip_image007   Now we are ready to select the data that appears in the chart. First we’ll segment the data by quarter. We invoke the User-defined Grouping Properties dialog box pictured below by clicking the ellipses in the corner of the User-defined Grouping (by quarter) tab in the Categories pane. The grouping feature provides you with maximum flexibility by allowing you to segment data based on variables identified in the taxonomy (e.g., reporting period, geographical area, division). Now we can use XPath in the Group By field to group the data by quarter, filter it based on the group we created (in this example only the second quarters will appear in the chart), and add a dynamic label. We want the chart to reflect all second quarter data for each of the revenue concepts we selected so we toggle Do not filter under Group key filter.   clip_image008   We can further filter the data by clicking on the ellipses on the Period tab in the Series pane to bring up the Period Properties dialog box. Here we’ve selected only duration periods (i.e., those with a start date and end date – instant periods have a single date reflecting the date that the “snapshot” was taken) and filtered based on year. In this example only data from the second quarter of 2009 will appear in the chart.   clip_image009   Finally we can fine tune the chart’s appearance by clicking on the All Settings tab under Chart Settings, which brings up the Change Appearance dialog box. Here we’ve opted to show the concept labels, values, and percent of total. We can also select color schema, chart size, font types and sizes for each section of the chart (e.g., chart title, labels, legend), and background colors.   clip_image010   After making all of these changes we hit OK in the XBRL Chart Wizard dialog box and the pie chart reflecting these changes is created. Please note that after the chart is created you can go back and edit the chart settings.   clip_image011   As you can see, the biggest source of revenues is Passenger tickets, which produced 75.02% of total revenues for Carnival Corp in the second quarter of 2009. As is the case with all StyleVision designs, output can be rendered in HTML, RTF, PDF, and Word 2007+ formats and an XSLT stylesheet for each format is automatically generated. And this was just one example of what kind of data you can extract from an XBRL filing and visualize in a chart. Next week we’ll look at creating bar charts and line charts from XBRL financial data. clip_image022 Have you created something really great with the XBRL Chart Wizard? Or developed an interesting project using StyleVision or another of our tools? Please share your story with other Altova users by commenting on this blog post. Think it would make a great case study? Email us at marketing@altova.com – if we choose to use your story you’ll receive a $200 Amazon gift card as well as some free press for you and your organization. We’d love to hear from you!
Processing the Groupon API with MapForce – Part 2


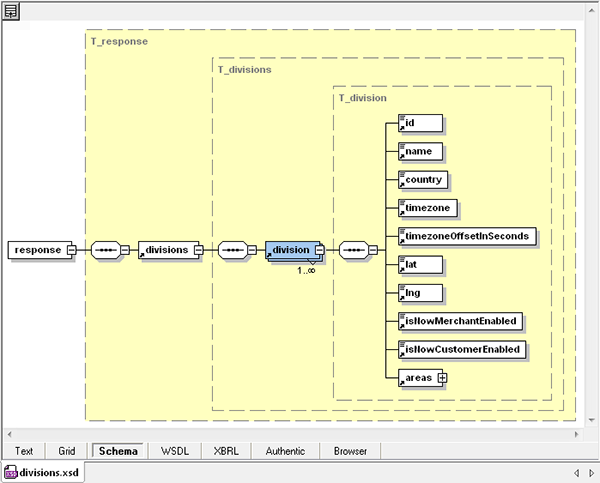
In Part 1 of this series we described how to connect Altova MapForce to the Groupon API. We queried the API for a list of Groupon divisions, then used the list to create API queries for all the current deals from every division. In this part, we will execute the /deals queries and filter the response for the most interesting data. The list of /deals queries we built previously looks like this: List of Groupon /deals queries generated by Altova MapForce To process all the queries, we can connect the list as a dynamic file input to a new mapping component. When we needed a new component last time, we dropped an API /divisions query into the mapping, and let MapForce create an XML Schema automatically. We could do the same thing here by dropping in an API /deals query as an XML input file. There’s just one small issue — although the Groupon API online documentation clearly describes the queries we can make, it is vague about the information that will be returned. Before we send dozens of queries to the API for all the current deals, we probably want to know a little more about the data that will come back.

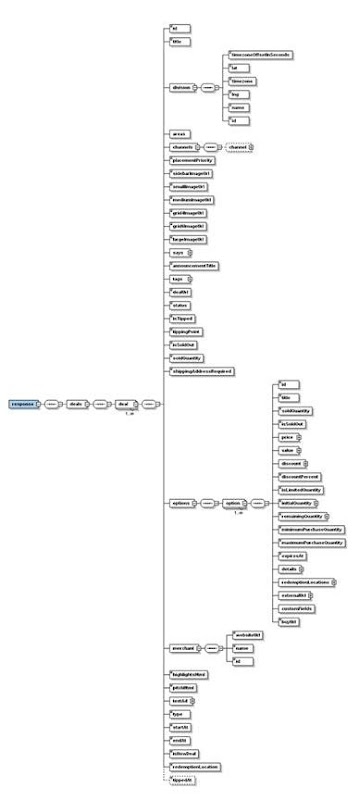
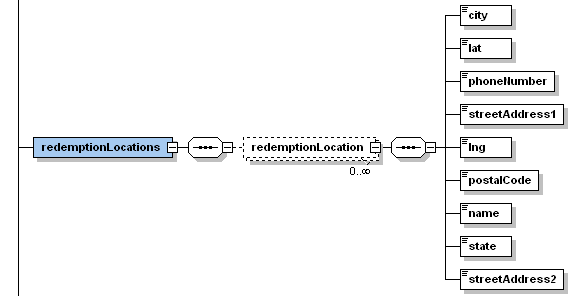
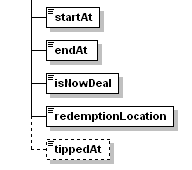
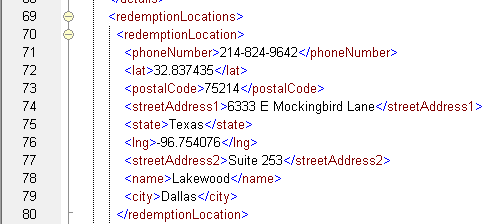
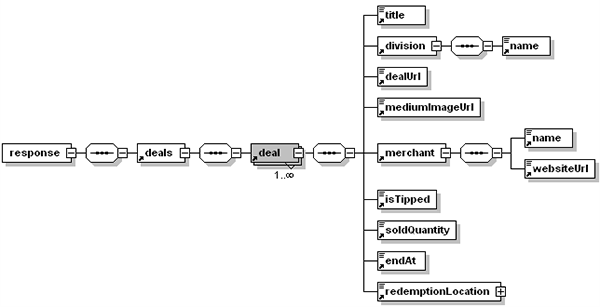
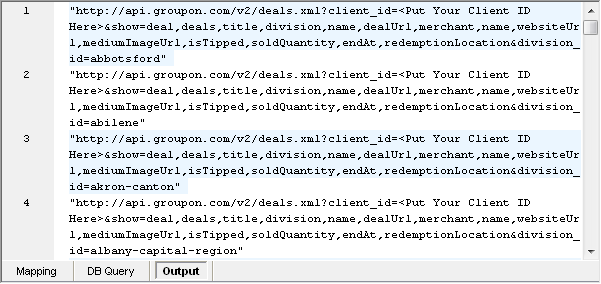
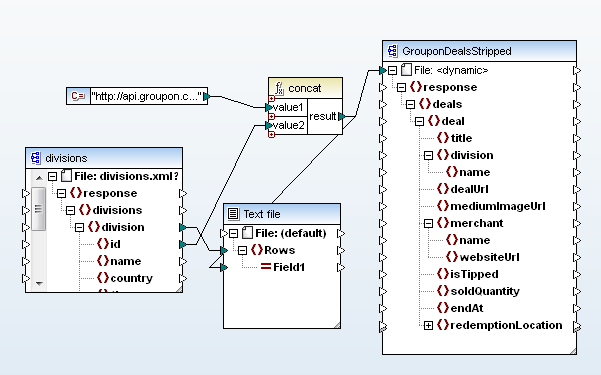
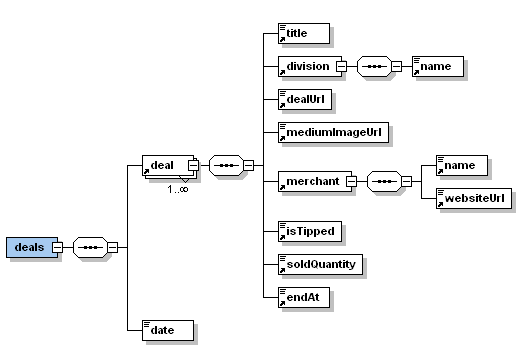
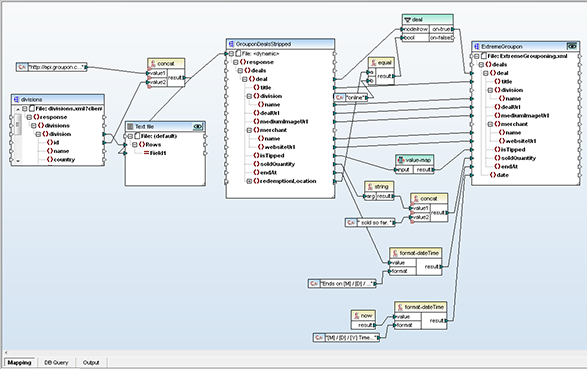
Let’s Make a Deal Like Yogi Berra said, you can observe a lot just by looking. Let’s start by running a /deals query in XMLSpy. That will let us examine the response to a query for one division before we pull in a potentially unwieldy volume of data. The XMLSpy File / Open menu includes the same Switch to URL option we used in MapForce in the earlier post. If we enter the /deals API query for a division that covers a large metro area – say Dallas – we are likely to get enough deals instances to extrapolate the characteristics of the entire data set. XMLSpy opens the response to the /deals API query in Text view just as if we opened a local file: Example from the response to a Groupon /deals query, shown in XMLSpy As expected, we got quite a bit of data when we requested all the deals for a single division! A fast way to analyze the structure of this data is to use the XMLSpy DTD / Schema menu option to generate an .xsd file from the xml. Shown below is a reduced view of the entire generated .xsd file based on the response to the /deals query for Dallas: An xsd file generated by XMLSpy from the Groupon query We can dig even deeper, following Yogi’s advice like déjà vu all over again. Expanding all the elements to review the XML Schema reveals some curious anomalies. For instance, there are two elements named redemptionLocation with different definitions. The first contains a sequence of child elements: First use of the remdemptionLocation element And the second is defined as a simple string: Second use of the remdemptionLocation element Going back into the xml data for Dallas and searching for redemptionLocation displays these examples: One example of redemptionLocation in the body of the response And: One example of redemptionLocation in the body of the response And: One example of redemptionLocation in the body of the response Now this is really interesting, because redemptionLocation = ”online” identifies deals that can be redeemed from anywhere, instead of by a visit to a bricks and mortar location in the division where they are advertised. What if we ran the /deals API queries for all divisions and extracted a list of all the online deals? That would be one extreme Groupon! Only Ask for What You Need The Groupon /deals API query supports an optional parameter called &show= that allows users to limit the data returned. Applying this parameter can save bandwidth and reduce processing time for the data transformation by removing unwanted data from the API response. We can also simplify our final result by including only the most interesting information, including the link to the Groupon web page for each deal. After we remove unwanted elements from the generated Dallas schema, our final version for the summary of online deals looks like this: XMLSpy Schema diagram of the simplified Groupon xsd file When we add the &show= parameter to our MapForce mapping to request only the elements included in the simplified XML Schema, the queries look like this: Modified list of queries with the &show= parameter Now we can drop the revised .xsd file into the mapping and connect the list of API /deals queries as dynamic input. We don’t need to delete the text file we used to collect the list of queries — that might continue to be helpful for future debugging. Mapforce dynamic input file mapping These changes complete the input side of the data mapping. Defining the Data Transformation Output Back in XMLSpy we can make a couple more revisions to the input XML Schema to design a new version for output: XMLSpy schema diagram of the output file xsd We discarded the response element since it doesn’t add any value, and eliminated the redemptionLocation element that we don’t intend to include in the output. We also added a date element for a timestamp, because our output file will be a snapshot of data that is constantly changing. After saving this version of the .xsd file in XMLSpy, we can drop it into the MapForce mapping. Shown below is the output side of the mapping with the output component partially connected. The filter at the top reads the redemptionLocation element to select only online deals and the now function inserts the date: Partial view of the MapForce output file mapping The last revision we made in the output XML Schema was to change several element types from dateTime, Boolean, and integer to the string data type to allow more descriptive text Here is the complete definition of the mapping with the final connections to the output component: Mapforce data mapping for the Groupon API Now for the Payoff When we click the Output button MapForce processes the entire mapping from beginning to end using the MapForce Built-in execution engine. Here’s a breakdown of the steps:

  • Run the /divisions query to get the current list of divisions
  • Concatenate strings to build the list of /deals queries for all divisions
  • Run the /deals queries to create dynamic data for the input component
  • Filter for online deals to generate the output component, execute the remaining mapping functions, and add the timestamp after all the deals are processed

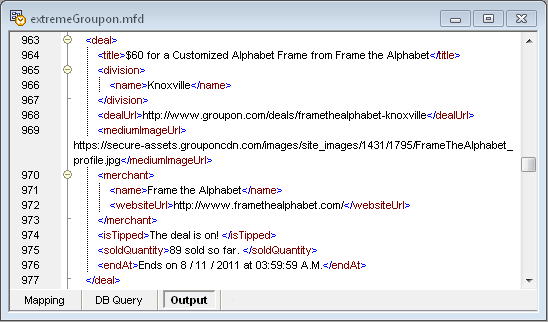
MapForce takes only a few seconds to complete all those steps and generate an output file with a series of deals that look like this: Output data from the MapForce mapping for the Groupon API In part 3 of this series we’ll design a stylesheet to automatically transform the XML output of our mapping into html for attractive presentation in a web browser and on mobile devices. See ya at the ballpark, Yogi! XMLSpy and MapForce are available together in the specially priced Altova MissionKit. See for yourself how easy it is to use the MissionKit to convert data from a Web API — download a free 30-day trial!
Editor’s Note: Our original series on mapping data from the Groupon API ran in three parts you can see by clicking the links here: Part 1 of Processing the Groupon API with Altova MapForce describes how to create dynamic input by collecting data from multiple URLs. Processing the Groupon API with MapForce – Part 2 describes how we filtered data from the API and defined the output to extract only the most interesting details. Processing the Groupon API – Part 3 describes formatting the output as a single HTML document optimized for desktop and mobile devices, and reviews ways to automate repeat execution.

Tags: , , , , , , ,

Processing the Groupon API with Altova MapForce


We often think of a data integration project as a translation from one singular data input file to some other data set, but Altova MapForce lets you greatly expand the concept of an input file. For instance, the MergeMultipleFiles.mfd example installed with MapForce illustrates how you can use a filename with wildcard characters to merge multiple input files into a single output. MapForce MergeMultipleFiles.mfd example A MapForce mapping input doesn’t even need to be a physical file – it can be a URL that returns predictable structured data, like the APIs for popular Web sites like Groupon and many others.

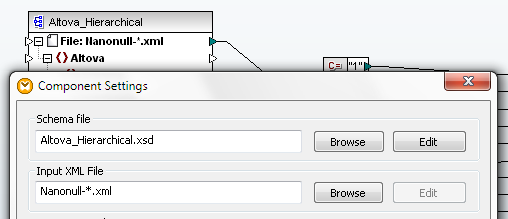
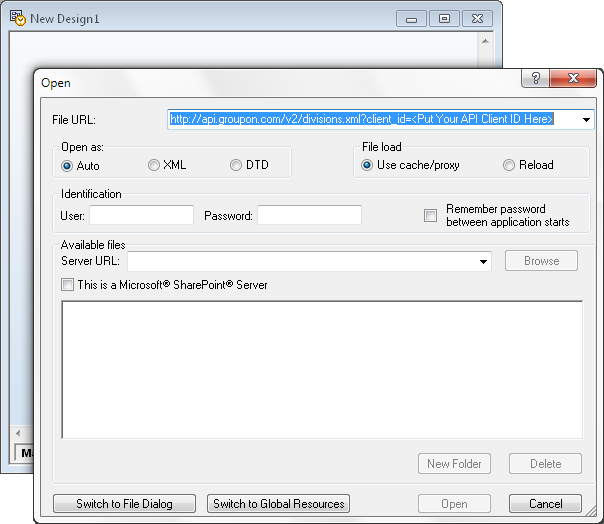
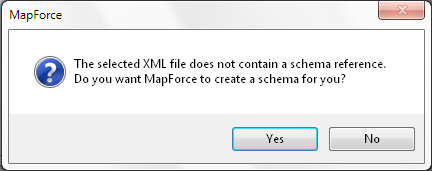
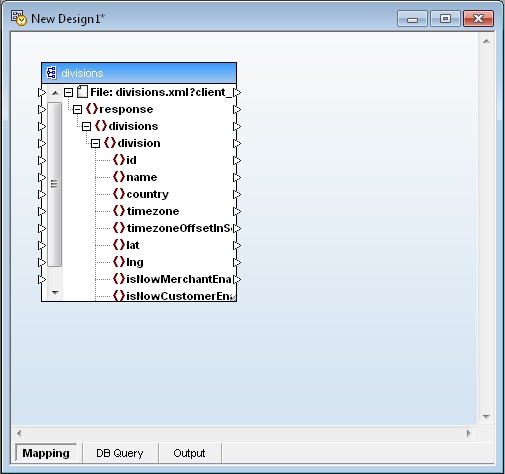
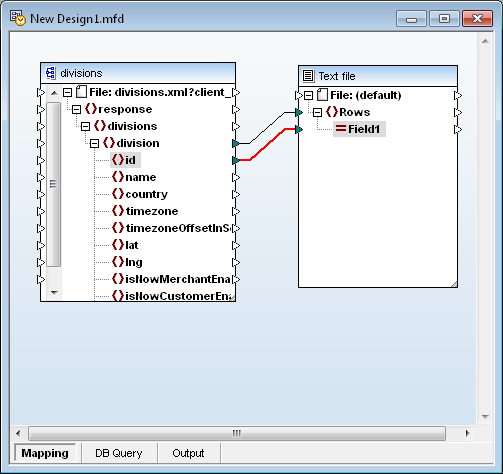
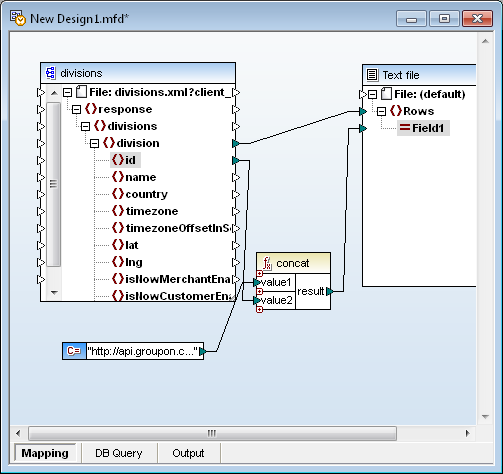
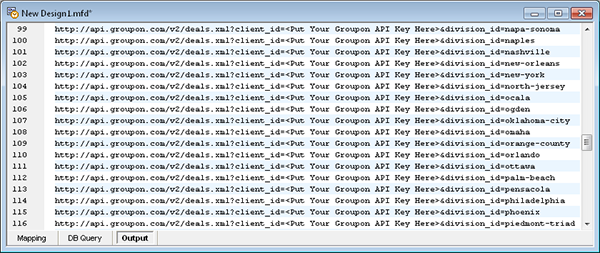
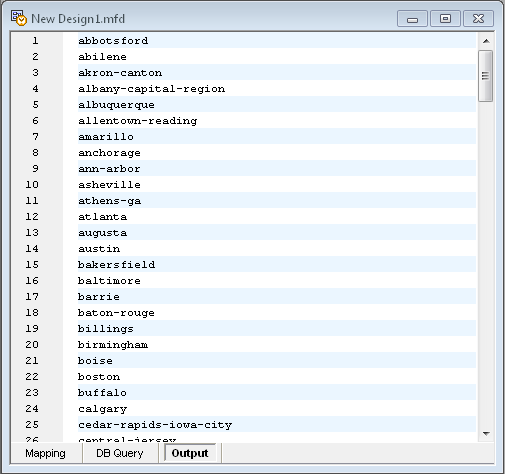
In this blog post we’ll describe how to use Altova tools to retrieve, filter, analyze, and present data available from a Web-based API, using Groupon as an example. If you want to follow along yourself, you will first need to visit http://www.groupon.com/pages/api to request your personal Groupon API client key. The Problem: All Deals Are Local The Groupon Web site and email subscriptions are great for finding deals in your local neighborhood, but what if you’re looking for a deal to use on an upcoming vacation, or for a gift for friends or family across the country? Sure, you could enter each location manually at the Groupon Web page, but that’s so last century. Let’s use the Altova MissionKit to automate things. The Groupon API offers two URL queries that return data in .json or .xml formats: the first returns a list of all Groupon localities (called divisions), and the second returns current deals information for one named division. If we want to see all the deals for more than one division, we need to resolve multiple URLs and aggregate the data into a single result. Yes, MapForce can do that! First We Need a Schema The Groupon API documentation describes the elements that will be returned by our requests, but doesn’t provide an XML Schema. That’s okay, we can use MapForce to generate one. All we have to do is open a new mapping design and choose Insert XML Schema/File, then click the Switch to URL button. Now we can enter the URL to retrieve the Groupon divisions list: Inserting a new component into a MapForce mapping by URL When we click the Open button MapForce offers to generate the schema: MapForce offers to generate an XML Schema When we click Yes, the File / Save dialog opens. I saved the schema as divisions.xsd, and the mapping with the new XML Schema inserted looks like this: Generated .xsd as a new component in a MapForce design And the Properties dialog for the XML Schema component automatically contains the API /divisions URL as the Input XML File: Component properties for the generated .xsd Check the Work We want to filter the Groupon divisions data to build a list of id names to use for deal queries for each locality. But before we go any further, now might be a good time to apply the text file trick from the Quick Solution for Complicated Functions blog post to look at the id values. When we insert the text file and connect the divisions and id schema elements, the mapping looks like this: MapForce design with text file to preview output We connected the division element to Rows in the text file in order to generate a new row in the text file for each unique division, so that Field1 in each row will hold the id. Clicking the Output button now generates this result: MapForce Output window All we need to do is apply the concat string function to build the list of /deal URLs for all division IDs. The next step in the mapping looks like this: Using the MapForce concat function to build a string Rolling the cursor over the constant connected to value1 of the concat function displays its full definition: Definition of a MapForce string constant When we click the Output button to execute the mapping, the Output file now looks like this: MapForce Ouput window As a further review, we can open the generated XML Schema in XMLSpy and display it in graphical Schema View: Altova XMLSpy graphical schema view of the generated .xsd So far we have:

  • built a MapForce mapping that queries the Groupon API for all divisions
  • extracted the division id fields
  • and built a list of URLs for API queries to get the deals in each division

In the next post in this series we will process the list of deal queries as the input for a new mapping component and filter the output for some interesting information. Find out for yourself how easy it is to apply MapForce to convert data from a Web API! Download a free 30-day trial of MapForce.
Editor’s Note: Our original series on mapping data from the Groupon API ran in three parts you can see by clicking the links here: Part 1 of Processing the Groupon API with Altova MapForce describes how to create dynamic input by collecting data from multiple URLs. Processing the Groupon API with MapForce – Part 2 describes how we filtered data from the API and defined the output to extract only the most interesting details. Processing the Groupon API – Part 3 describes formatting the output as a single HTML document optimized for desktop and mobile devices, and reviews ways to automate repeat execution.

Tags: , , , , , ,

Switch Statement vs. Look-up Table in MapForce


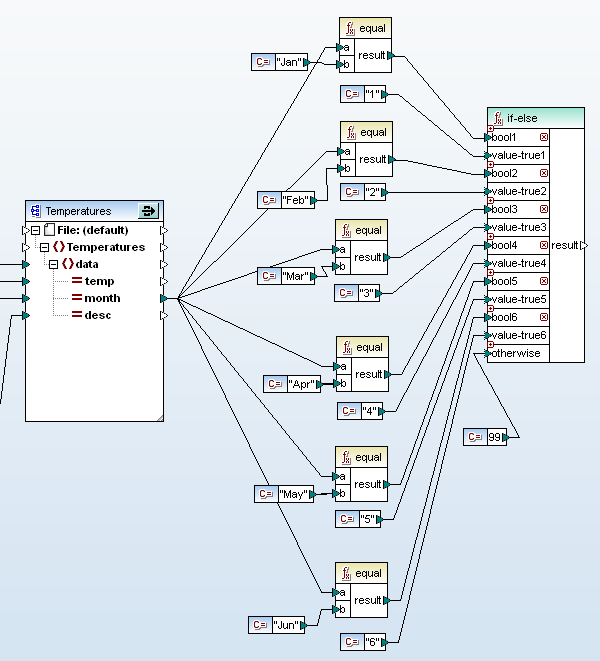
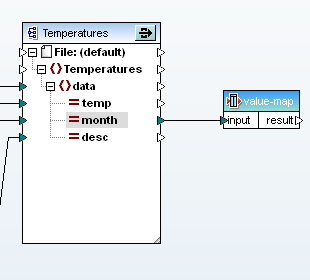
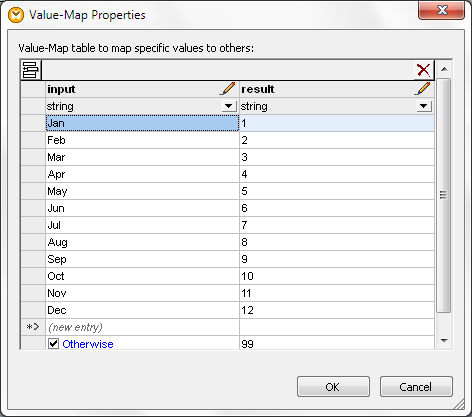
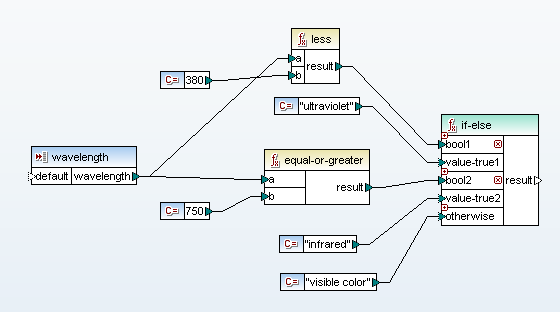
One of the great things about working with software developers is you not only get to create new things that never existed before, you also get to see how other peoples’ minds work when they discover alternate solutions to any design challenge. We received a comment from a software developer on our recent post titled Expandable If-Else Works like a Switch Statement in MapForce regarding one of the examples we used. The reader suggests that our second example illustrated a problem that would be more elegantly solved in Altova MapForce with Value-Map than by our Expanded If-Else statement. Here was the original example that received the month as a string of characters and needed to generate the corresponding number: Original Expanded If_Else example in MapForce A Value-Map in MapForce is an alternate solution that functions as a look-up table, whereas an Expanded If-Else acts like a switch statement. Here is how our mapping would look with a Value-Map in place of the Expanded If-Else: Value-Map alternative in MapForce Yep, that’s it. Rather than copying, pasting, and modifying sets of elements the way we built our original Expanded If-Else, a Value-Map lets us easily create the entire look-up table in its Properties dialog: Value-Map Properties dialog in MapForce We accept the commenter’s point — Value-Map definitely works better for the problem we chose because it’s much quicker and easier to create! The table from the Value-Map properties is also more concise and easier to interpret in MapForce-generated mapping documentation than our original Expanded If-Else structure. Of course you can’t always replace an Expanded If-Else statement with a Value-Map. Data entering the Value-Map must equal a single value in the input table to generate a specific output, whereas Expanded If-Else lets you set up a series of conditions with different logical tests. Sometimes the exact nature of a data conversion project makes it a judgment call to use a switch element vs. a look-up table. Let’s say your project receives input as a number that represents a wavelength of the electromagnetic spectrum and you want to handle ultraviolet, visible colors, and infrared energy individually. In that case we could use an Expanded If-Else to test for ranges of input values. The Expanded If-Else section of the mapping might look like this: Expanded If-Else mapping in Altova MapForce If the input is an integer, you could also create a solution using Value-Map, but you would need to build a very long look-up table. And then what happens later if the project requirements change and the input becomes a decimal number, or you need to filter each visible color separately by name? Essentially Altova MapForce is a really cool graphical representation of a complete software language toolbox that insulates you from detailed programming language syntax, with a rich collection of components you can assemble creatively to solve your own data mapping, conversion, and integration challenges. Find out for yourself how easy it is to apply MapForce to your own data mapping projects. Download a free 30-day trial of MapForce.

Tags: , , , , , ,

Expandable If-Else Works like a Switch Statement in MapForce


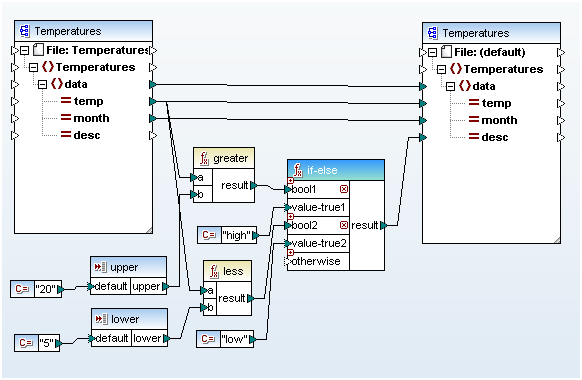
In response to several user requests, the if-else component in MapForce has been enhanced in MapForce 2011 Release 2 to accommodate any number of variables. This feature, which is equivalent to a switch statement in many programming languages, enables you to easily control the flow of data in a mapping project by matching a value to a selected criterion. For example, the screenshot below shows the if-then component used in combination with other components to analyze temperature data and produce the following results:

  • If temp is greater than 20, true is passed on to bool1 and "high" is passed on to value-true1.
  • If temp is less than 5, true is passed on to bool2 and "low" is passed on to value-true2.
  • Only one of the value-true parameters can be true for any given temperature, and that is the one that is passed on to the desc attribute in the target component.

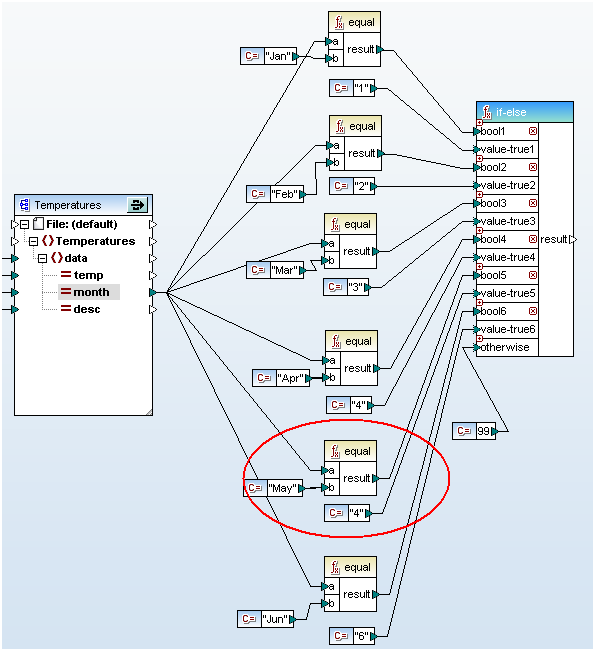
Expandable if-else example included with MapForce The screenshot above is taken from the sample file Classify Temperatures.mfd included during the MapForce installation, so you can immediately process the sample data or modify the mapping to see the output for yourself. The new expandable if-else functionality helps developers build data mappings more rapidly, creates a mapping diagram that displays the conditional test more effectively, and facilitates testing and debugging because the expanded if-else function is much easier to read than a cascading structure of individual components. This is even more obvious when you have to evaluate a large number of conditions. The screenshot below shows a conversion from string to number where the string consists of a three-letter abbreviation of the month. (To save space here, this if-else function only processes strings for the first six months of the year.) Expandable if-else statement in MapForce In a copy-paste oversight we forgot to update the output constant for May from the value 4 to 5. That’s a much easier error to find and fix when you can see all the logic in one view!(UPDATE: We originally created this example to illustrate the advantages of Expanded If-Else over nested or cascading If-Else mappings that can quickly grow too large to view on a single screen. For a better design for solving this and other similar conversions using a look-up table, see the Switch Statement vs. Look-up Table in MapForce blog post.) Find out for yourself how easy it is to use expanded if-else functions in your own data mapping projects. Download a free 30-day trial of MapForce.

Tags: , ,

MapForce Japanese Version – 日本語版 MapForce


ホームページXMLSpy 製品ページ含む Altova ウェブページの多くが日本語化されました!この作業は今後も継続して行われ、新たに翻訳されたページもできる限り素早く追加していく予定です。 We are excited to announce that a large portion of the Altova Web site – including the home page and XMLSpy product pages – is now available in Japanese! This is an ongoing effort, and new translated pages are being added as quickly as possible.

日本語版 MapForce 2010

他にも、次の日本語化された Altova バージョン 2010 製品となる MapForce 2010 のリリースを行いました。MapForce データマッピングツールは XMLSpy と共に完全に翻訳され、英語版、ドイツ語版と共にお求め頂けます(単一のライセンスキーコードにより使用する言語に関係なく製品のアンロックを行うことができます)。 日本語ユーザも、XML、データベース、EDI、フラットファイル、Excel 2007+、XBRL、そしてウェブサービスと言ったデータのマッピングと変換をグラフィカルに行う MapForce インターフェースを利用できるようになりました。無料トライアル版をダウンロードする際に、言語ドロップダウンから日本語を選択してください。 続けてその他の製品についても、地域化を続けて行く予定です。ご期待下さい!   We’ve also released the next Altova Version 2010 product to be localized in Japanese: MapForce 2010. The MapForce data mapping tool joins XMLSpy in being fully translated and available for download in Japanese as well as English and German. (A single license key code unlocks whichever language version you install.) Now Japanese-speaking users can take advantage of the graphical MapForce interface for mapping and transforming data in any format, including XML, databases, EDI, flat files, Excel 2007+, XBRL, and Web services. Simply select Japanese from the language drop down when downloading a free trial. We will continue localizing the rest of the product line throughout the year – stay tuned for more news!   altova_jp

Tags: , ,

Altova MapForce Brings Powerful Data Transformation Capabilities to Quark Dynamic Publishing Solution


This week Altova announced the integration of Altova MapForce, its conversion and data mapping tool, with Quark® Dynamic Publishing Solution. Through Automation Services™, a component of Quark’s dynamic publishing software, MapForce transformations translate XML into Web publishing formats, transform QuarkXPress® layouts for digital publishing, and convert XML to print pages, providing multi-channel publishers with a complete, automated XML-based publishing solution. This solution highlights two powerful features of MapForce that have demonstrated benefits to users with a wide range of data conversion needs: The MapForce visual data mapping interface supports integrating data as the source or destination in virtually any format, including XML, databases, flat files, EDI, Excel 2007+, XBRL, and Web services. MapForce includes the ability to automate data integration and repeatable business processes through an automation interface that lets developers access its advanced features programmatically. Users can also automate MapForce through the command line interface, or by using MapForce generated royalty-free code in XSLT 1.0/2.0, XQuery, Java, C++ or C#. mapforce_data_mapping_thumb “Having the ability to transform and publish data to multiple channels using an automated process helps users improve productivity and cut costs,” said Alexander Falk, President and CEO for Altova. The Altova Web site features a series of MapForce flash videos that each demonstrate a significant feature in 4 minutes or less. The Altova Online Training page offers three free MapForce self-paced training modules for Beginning, Intermediate, and Advanced data integration needs. Find out for yourself how convenient and cost-effective can be to solve your data conversion requirements. Click here to download a fully functional, free 30-day trial of Altova MapForce 2010!

Tags: , , , ,

New MapForce Online Training


If you’re not already familiar with MapForce, Altova’s award-winning graphical data integration tool, now’s the perfect time! Altova has just released a new MapForce course as part of its line of free online training modules. The new course has been completely updated with comprehensive data mapping training for beginning, intermediate, and advanced users and includes step-by-step tutorials, evaluation exercises, and a chance to work with mapping files and functions that meet a broad range of needs. data_integration_thumb So roll up your sleeves, download a free 30-day trial of MapForce, go to our training page, and get your hands dirty with some powerful visual data transformation from Altova!

Tags: , ,

HL7 and XML Healthcare Data Integration at HIMSS10


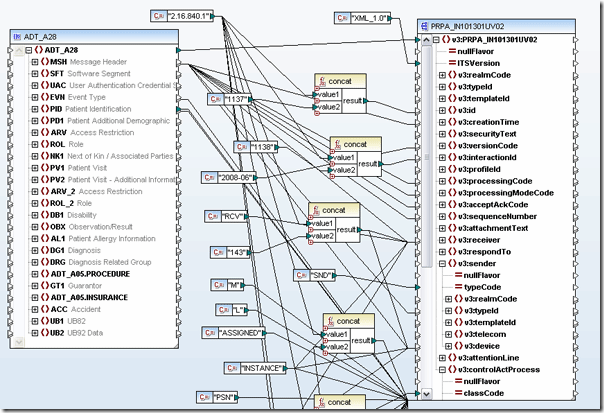
Altova is kicking off the 2010 trade show season with our first participation in the annual conference of the Healthcare Information Management Systems Society (HIMSS). The HIMSS10 conference will be held on March 1-4 at the Georgia World Congress Center in Atlanta. We’re looking forward to demonstrating the functionality in XMLSpy 2010 for editing, analyzing, and validating HL7 healthcare data. We will also show how MapForce 2010 can map older EDI-based legacy healthcare records to the latest XML-based HL7 v3.x standard. The example below shows a simple MapForce mapping to update an HL7 v2.6 message to v3.x. MapForce mapping for HL7 This will be our first opportunity to demonstrate the new Altova MissionKit 2010 Release 2 with significant speed and performance enhancements across the product line. Come see the new 64-bit versions for yourself, or download a free trial today. If you are one of the expected 30,000+ attendees traveling to Atlanta for HIMSS10, stop by and see us at booth 5744. Or click here to get more information on the Altova MissionKit and HL7.

Tags: , , , , , ,

MapForce v2010r2 New Features


2010 has already been a very busy year at Altova, with our v2010r2 release now just three days old. Continuing on the Most Wanted theme of our v2010 launch, we have added several great new features to MapForce in response to customer requests (just in case you thought we weren’t listening) – but first let’s talk a bit about 64-bit versions. MapForce, and all of the other tools in the MissionKit, are now available in 64-bit versions for the same price as the 32-bit downloads (SMP subscribers can use their current keycodes for 64-bit versions). Customers running 64-bit operating systems will now be able to take full advantage of much faster processing speeds for integrating large files (100 MB+) in MapForce. For the developers, we have also added support for external C# and Java calls in mapping transformations, so that you can get an accurate preview of your mapping in the output window. We’ve also developed a new process for adding C# and Java libraries – by simply selecting the .NET assemblies of Java class files to import. For EDI specialists, we’ve added automatic generation of X12 997 functional acknowledgement messages to confirm message receipt or relay transaction errors. clip_image002 And… for everyone else, we’ve added three new string functions: tokenize, tokenize-regexp, and tokenize-by-length. As you can see, there’s a little something for everyone here, so download a free trial of MapForce today to check it out – or, if you have SMP, take advantage of your free upgrade!

Tags: , , , ,

What's New in MapForce 2009?


It feels like we’ve been writing about XBRL and HL7 for months…  Let’s move away from that topic for the moment and talk about additional essential new functionality added to MapForce in the v2009 release. Granted, some of these features have been added as a necessity for mapping to/from multi-dimensional XBRL data, but they also transcend well beyond interactive financial data reporting to the other aspects of mapping XML, database, flat file, EDI, Excel 2007, and Web services data in MapForce.

Custom Functions for Data Mapping

MapForce functions add a custom data processing layer to your mappings, letting you reformat output structure and even manipulate content on-the-fly. With v2009 we have added a grouping, distinct-values, and a predicated position function to the already well-shelved MapForce function library. Grouping functions can be selected for code generation in XSLT 2.0, Java, C#, and C++ and let you effectively reorganize source data into based on common values:

  • group-by – reorganizes data in the output document based on a specified common value, or grouping key
  • group-adjacent – applies grouping to an alternating sequence of items, assigning items that have a common value to the same group
  • group-starts-with – begins a new group based on a specified pattern and puts all subsequent items into the same group until another item matching that pattern is found
  • group-ends-with – ends a new group based on a specified pattern and puts all subsequent items into the same group until another item matching that pattern is found

The distinct-values function is a data filtering operation that, simply put, automatically ignores duplicate input values when writing mapping output results. MapForce distinct-values function MapForce also now includes a predicated position function that lets you filter out data based on its context position in the input document. For example, the mapping below will return data for only the first two people listed in the source document. MapForce position function  
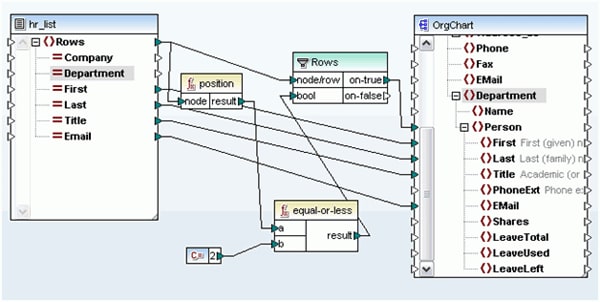
Extended Database Support

For users creating database mappings, MapForce 2009 provides new native support for additional databases: Microsoft SQL Server 2008, Oracle 11g, and PostgreSQL 8. It also now supports mapping XML fields in SQL Server. The complete list of natively supported databases is:

  • Microsoft® SQL Server® 2000, 2005, 2008
  • IBM DB2® 8, 9
  • IBM DB2 for iSeries® v5.4
  • IBM DB2 for zSeries® 8, 9
  • Oracle® 9i, 10g, 11g
  • Sybase® 12
  • MySQL® 4, 5
  • PostgreSQL 8
  • Microsoft Access™ 2003, 2007

Data Mapping Documentation

The ability to generate data mapping documentation makes it much easier to collaborate on large data integration projects, which often include a variety of designers, developers, subject matter experts, and stakeholders. Generate mapping documentation  

Find Dialog for Identifying Nodes

And now for a personal favorite: a new find feature. Yes, this may sound very simple and mundane – unless you have had the pleasure of mapping large and complex multi-layered data components like XBRL and EDI (there we go again!). Consider, for example, digging through an HL7 ADT A05 transaction to find the second CWE identifier field under the fifteenth PR1 segment. Find dialog Ahhh… much easier!! Take a look at the full list of new features in MapForce v2009 – and, as always, keep in mind that Altova adds new functionality to all of the MissionKit tools based on user requests… so keep ‘em coming!
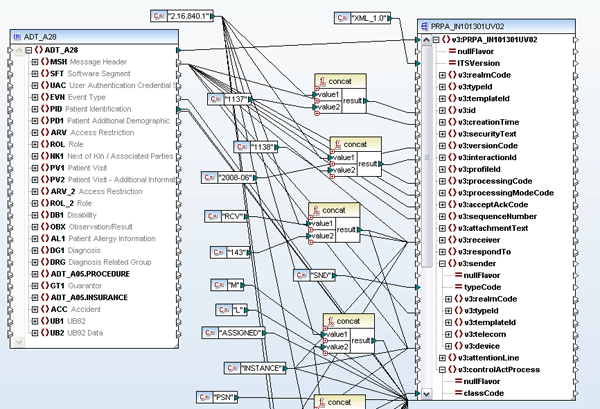
Tags: , ,

HL7 Data Integration


By now, you may be aware of the global push that is being made for data transparency – both in the realm of financial reporting* with a recent XBRL mandate in the U.S., and electronic health records – and that these efforts are focused on the creation and maintenance of XML standards. Of course most of you are among the XML savvy and can feel free to please join me in a resounding “duh” to the rest of the world that is only now beginning to realize the value of XML data in reducing errors, lowering costs, and generally increasing the overall efficiency of data management. But for now, let’s focus a bit on healthcare data and standards. Both HL7 and the HIPAA mandated X12N formats healthcare data exchange have traditionally been EDI-based, but the newest version of HL7 (version 3.x), released in 2005 is XML-based and constrained by a formal framework (HDF) that allows for an evolving data model within a carefully defined development methodology. Yes people, standards – bring it on!! Well, of course there is a need to map this data from the HL7 EDI to HL7 XML, to and from backend systems, to Web services and beyond. So what now? Do you need to become an expert in all of these formats? Weren’t standards supposed to make things EASIER? Please ladies and gentleman, return to your seats! Let me draw your attention once again to MapForce, the coolest data integration tool on the market, with support for mapping and converting data to and from XML, databases, flat files, EDI (including HL7, X12, and EDIFACT), Excel 2007, and Web services. HL7 mapping in MapForce The shot above shows a simple graphical mapping updating an HL7 v2.6 message to v3.x. Altova MapForce is an any-to-any visual data mapping tool that supports mapping HL7 data, in its legacy EDI or newer XML-based format, to and from XML, databases, flat files, other EDI formats, and Web services. Mappings are implemented by simply importing the necessary data structures (MapForce ships with configuration files for the latest EDI standards and offers the full set of past and present HL7 standards as a free download) and dragging lines to connect nodes. A built-in function library lets you add advanced data filters and functions to further manipulate the output data. MapForce can also facilitate the automation of your HL7 transaction workflow through code generation in Java, C#, or C++ and an accessible command line interface. Additional support for mapping HL7 data to and from Web services gives healthcare organizations the ability to meet new technology challenges and changing enterprise infrastructures as they unfold within internal and external provider domains. Read more on our new HL7 tools page in the Altova Solutions Center.   *The Altova MissionKit has been infused with XBRL support to meet financial reporting mandates.

Tags: ,

New MapForce Online Training – Code Generation


I’m pleased to announce that the next module in the Altova Online Training Series on the MapForce data mapping tool is now available. MapForce Code Generation is an advanced-level course that provides step-by-step tutorials for generating program code (including C# , C++, Java, XSLT, and XQuery) based on graphically defined data mappings and integrating that code into your own applications (royalty-free). Detailed tutorials also walk you through how to add custom XSLT and XQuery functions, add function libraries, and process mappings with multiple files.The MapForce Code Generation module is available on-demand, so you can learn when your schedule allows, and, like all Altova Online Training courses, there is no fee or registration required. Please let us know what you think of MapForce Code Generation – comments and suggestions are appreciated.

Tags: , ,

MapForce data mapping tool now supports Excel 2007/OOXML mapping


We’re excited to have recently announced the availability of Altova MapForce Version 2008 Release 2 (v2008r2). The latest update to the MapForce graphical data mapping tool provides  powerful new functionality, including support for mapping Microsoft® Excel 2007, which uses the Office Open XML (OOXML) file format, integration with and project generation for Visual Studio® 2008, support for data streams in MapForce generated code, and much more.
Come visit us at Microsoft TechEd 2008 in Orlando this week and next at booth# 1114 and we’ll be happy to demo the new features to you.
data_mapping_tool

Tags: , , , ,

Case Study: MapForce EDI Conversion Optimizes Business Transactions


National Frozen Foods Corporation, a family owned company, works with many vendors to get their products from the warehouse out to the market. Communications between the warehouse and vendors are sent via the X12 dialect of Electronic Data Interchange (EDI), a standard data format for business transactions.
The company had been using the EDI format for its B-2-B transactions, but relied on outside consultants to convert their internal flat file format (EIF) into EDI for processing. Such outsourcing proved to be expensive, often untimely, and introduced bugs, which then required additional development costs. Recognizing the need to create a more efficient documentation workflow that would cut costs and save time, National Frozen Foods decided to bring their EDI conversion in-house.
The solution they chose – Altova MapForce – is a visual data mapping and code generation tool that allows you to map and convert any combination of XML, database, flat file, EDI, Excel 2007, and/or Web services data formats.
With its built-in EDI support, flat file conversion, and code generation capabilities, along with its ease-of-use, MapForce helped National Frozen Foods successfully bring their EDI implementation in-house.
Using the MapForce FlexText module, NFF can directly parse the internal flat file format using a convenient graphical user interface:

The company can now maintain a codebase that can be easily modified and re-used for future transactions and thus eliminate their need for outsourcing.
For more information, access the full case study and more screenshots or download a free 30-day trial of Altova MapForce.

Tags: , , ,

LANSA OEMs MapForce to Convert Data in Business Process Integration App


A recent article in Database Trends & Applications magazine highlights how MapForce, Altova’s graphical mapping, conversion, and integration tool is working behind the scenes for LANSA Composer to give non-technical users the power to perform business process automation tasks.
LANSA, a software company offering a development environment for application generation and integration on multiple computer systems, chose MapForce because it was the only candidate that met the project’s four most important criteria:

  • Code-free user interface
  • Support for a full range of document formats, including XML, text files and EDI
  • Database support across all the platforms LANSA supports
  • Cross platform capabilities

LANSA Composer uses the MapForce application as its transformation component. MapForce generates a platform-independent Java applet behind the scenes based on the user input from the mapping. While invisible to the LANSA Composer user, the code enables the business processing engine to execute the transformation component of the business process integration sequence.
Altova MapForce Data Mapping Tool
Read the entire article, featured in the March issue of Database Trends & Applications magazine, as well as other recent reviews and news stories here: https://www.altova.com/news_and_reviews.html
Download a free 30-day trial of Altova MapForce at: https://www.altova.com/download.html to see how easy it can be to map between XML, database, EDI, flat file, and Web services data formats.

Tags: , , ,