New JSON Schema Editor and Data Mapping Debugger Debut in Altova Version 2016
We are excited to announce details of the latest release of Altova MissionKit desktop developer tools and server software products. Version 2016 includes full Windows 10 compatibility and updated relational database support across the product line, and it also introduces some new features that you simply will not find anywhere else.
XMLSpy 2016 includes the first full featured, enterprise-grade graphical JSON Schema editor. MapForce, our data integration tool, now includes a data mapping debugger that will revolutionize the way you define and test data mapping projects. Let’s take a closer look at these new features.
JSON Schema Editor
The JSON Schema standard emerged in response to the need to define and enforce the structure of data on a per-application basis. Slower to develop, however, was a JSON Schema editor with the features and functionality today’s developers need. That all changes with the new JSON Schema editor in XMLSpy. Current customers will immediately recognize JSON Schema view, which was based on the ever-popular XML Schema editor – but if you’re new to XMLSpy you’ll grasp it right away too. It’s easy to use and will expedite your JSON schema development with features including:
- Graphical, drag and drop JSON Schema design
- Intelligent entry helper windows and context menus
- Validation of JSON Schemas and instances against schemas
- One-click generation of JSON Schemas from JSON instances
- High-performance validation of JSON projects (see next section)

This new functionality enhances existing features in XMLSpy including:
- Intelligent editing of JSON instances in text or grid view
- XML to JSON conversion, JSON to XML conversion
RaptorXML Server Integration for XSLT and XQuery Jobs
In XMLSpy Version 2015 Release 4, we introduced the option to run XML validation jobs on your installed RaptorXML Servers from inside XMLSpy, increasing validation speeds for large numbers of files anywhere from 6-18 times.
Now, that same functionality is extended to XSLT and XQuery jobs. Because you’re utilizing the parallel processing power of a RaptorXML Server running on multiple cores, these transformations will complete up to 14 times faster – all directly inside XMLSpy!

This increased synergy makes RaptorXML Server even more useful for development teams, because you can now take advantage of a single shared RaptorXML Server to torch previously time-consuming transformation jobs for large numbers of documents.
By the way, RaptorXML Server 2016 now also supports JSON validation, so this functionality is available for validating large JSON files in XMLSpy, as well.
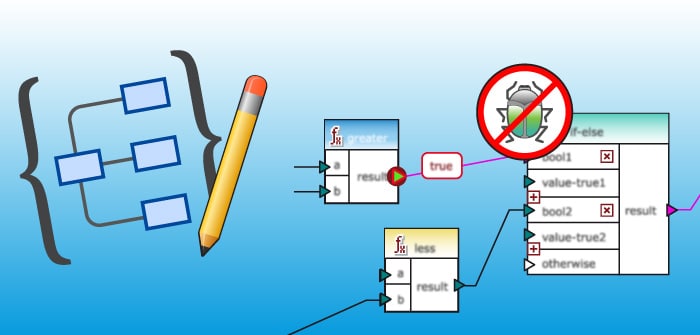
MapForce Data Mapping Debugger
MapForce makes it easy to define sophisticated data mapping rules for integrating all types of data. However, for complex mapping projects with multiple functions, data sources, or custom decision logic, it can sometimes be difficult to track down errors when the mapping does not produce the expected results.
Now, the MapForce data mapping debugger lets you examine your mapping output step by step, to diagnose and perfect projects of any complexity.
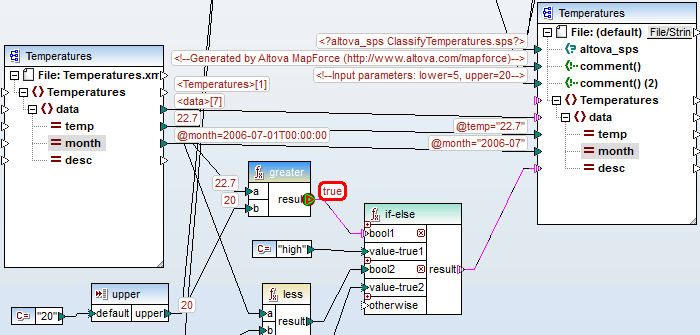
Once invoked, the debugger allows step by step execution of your data mapping design with display of all intermediate values. The MapForce data mapping debugger comes with new menu commands, a new toolbar, and new helper windows that are opened automatically while the debugger is running, so you can trace the intermediate processing operations and examine data values as your mapping executes.
The MapForce data mapping debugger supports:
- Setting breakpoints on any input or output node
- Conditional breakpoints
- Manual, step by step debugging
- Display of all intermediate values in the graphical mapping view during mapping execution
- Context window showing which nodes/functions have been processed
- History window showing a list of every value that passed through a selected point during execution
- Partial output that shows what content has been written to the output file already during single-step execution or when reaching a breakpoint
This new data mapping debugger is revolutionary because it gives you deep insight into the exact inner workings of your data integration and ETL projects in a way that was never possible before, not even in much higher-cost mapping products. The ability to easily define breakpoints, watch the data essentially flow through your mapping, and examine throughput data at each step makes it much more efficient to isolate and resolve errors to produce the most accurate data mappings possible.
These are just a few highlights of the new release. Check out all the new features in v2016 and update to the latest version now!