The hardships affecting today’s economy present new challenges for organizations. Interdepartmental budgets are being cut, and large purchases are being carefully scrutinized. Costly enterprise software and mainframe computing systems that once held promise are being reconsidered on a global scale in favor of more agile, component-based systems that cut costs and increase efficiency with forward-thinking concepts like Service-oriented Architecture (SOA) and cloud computing. These architectural concepts incorporate modern technologies and object-oriented approaches to solve real-world technology issues in complex environments while decreasing maintenance, integration, and deployment costs with modular design and component re-use. The Altova MissionKit is a highly affordable toolset uniquely suited to address this shift toward more flexible and lightweight infrastructure. With strong support for XML, UML, databases, and data integration technologies, the MissionKit offers all of the tools necessary to build agile architectures replete with repeatable services, reusable components, and scalable resources.
SOA & Cloud Computing
SOA and Web/cloud services are two of the strongest buzzwords in technology today. Though they have some clear differences, both of these concepts represent a paradigm shift from large-scale enterprise systems to service-based architectures built on modular components and reusable functionality. The SOA approach aims to help organizations respond more quickly to business requirements by packaging processes as a network of interoperable and repeatable services. This modularity creates system flexibility and gives developers the agility required to build new capabilities into the current system as needed – without reinventing the proverbial wheel. SOA is essentially a series of interconnected and self-contained services, the functionality of which is dynamically located and invoked based on certain criteria, communicated in messages. At the heart of SOA is a high level of component reuse that drives down costs and increases efficiency in a fully scalable architecture. Cloud services build upon the concept of interoperable services, adding a virtualization component to help relieve internal servers from being overtaxed by the constant reuse of these services within the system. This paradigm uses the Internet and Internet-enabled technologies to increase performance and processing speed by storing information permanently in the "cloud" and caching it only temporarily on client machines. Cloud computing implementation is a powerful option for increasing system capacity and capabilities by leveraging next-generation data centers in combination with the World Wide Web. Both SOA and cloud computing seek to alleviate problems created by inflexible architectures that rely heavily on tightly coupled enterprise application infrastructure. This focus on interoperability and independent software services reveals a distributed solution that is event-driven, flexible, and cost conscious in almost any setting.
Anatomy of a Service-based Architecture
Since their inception, XML and Web services have been continuously gaining notoriety as the standards of choice for secure, efficient, and platform-independent data exchange between software applications and over the Internet. XML provides the foundation for the protocols that power Web services infrastructure: WSDL (Web Services Description Language) and SOAP, an XML-based messaging standard. Web services are hardware, programming language, and operating system independent, meaning that they are duly amenable to the seamless and interoperable exchange of data over a network and uniquely suited to component-based systems. Web services architecture  Both SOA and cloud-based architectures generally rely on WSDL to describe interaction and functionality and locate operating components within the system. WSDL works hand-in-hand with SOAP, a messaging protocol used by the client application to invoke the methods and functions defined in the WSDL description. The example below is the stock quote example used in the W3C WSDL specification and describes a simple, single operation service that retrieves real-time stock prices based on ticker symbol input. Of course, most services that exist within enterprise architectures are far more complex.
 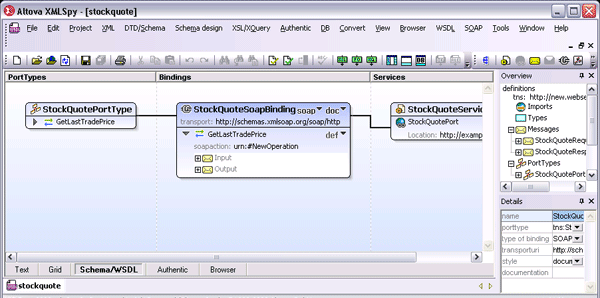 Take, for example, the publicly available Amazon Web services, which provide accessible Cloud services and infrastructure to a growing number of companies worldwide, including Twitter, SmugMug, and WordPress.com. These services essentially allow independent organizations to rent some of the immense power built into the Amazon distributed computing environment and add the same scalability, reliability, and scalability to their online presence at a fraction of the price. The much anticipated Windows Azure from Microsoft® operates on a similar model, giving developers the opportunity to build and deploy cloud-based applications with minimal on-site resources. Amazon provides a WSDL file that contains the definition of the Web service, the requests that the service accepts, and so on. Developers can then write a SOAP-based client application that invokes the Amazon Web service for the functionality it provides. (At this time Amazon provides a number of Cloud-based services for application hosting, backup and storage, content delivery, e-commerce, search, and high-performance computing.)
Altova MissionKit
Recently named "Best Development Environment" in the Jolt Product Excellence Awards, the Altova MissionKit is a diverse set of software tools that provides scalable options for leveraging your current software assets in an SOA or cloud-enabled environment. Strong support for XML, Web services, data integration, process automation, and databases, as well as accessibility to powerful APIs give developers flexible options for creating service-based solutions and an affordable alternative to costly consultant fees, extract/transform/load (ETL) tools, and/or enterprise service bus (ESB) products. The Altova MissionKit* supports end-to-end Web services development and includes a graphical WSDL editor, visual Web services builder, advanced capabilities for managing WSDL and other XML file relationships, a SOAP client and debugger, WSDL data integration, code generation, and more. Together, all of these features provide a robust solution for integrating disparate services and systems in a distributed computing environment, whether the components be in-house, network, or Cloud-based.
WSDL Editor
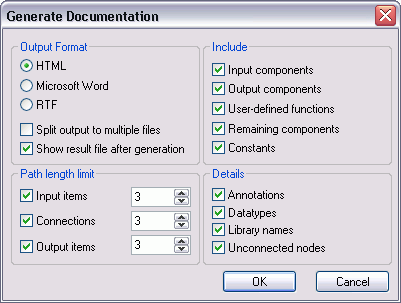
The XMLSpy XML editor provides a graphical interface (GUI) for designing and editing WSDL documents. The structure and components of the WSDL are created in the main design window using graphical design mechanisms (with tabs allowing users to toggle back and forth between text view), and additional editing capabilities are enabled from comprehensive entry helper windows. Users can easily create and edit messages, types, operations, portTypes, bindings, etc., inline. In addition, publicly maintained WSDL files like the Amazon Simple Storage Service, or Amazon S3, (below) can be opened instantly using the Open URL command in XMLSpy. 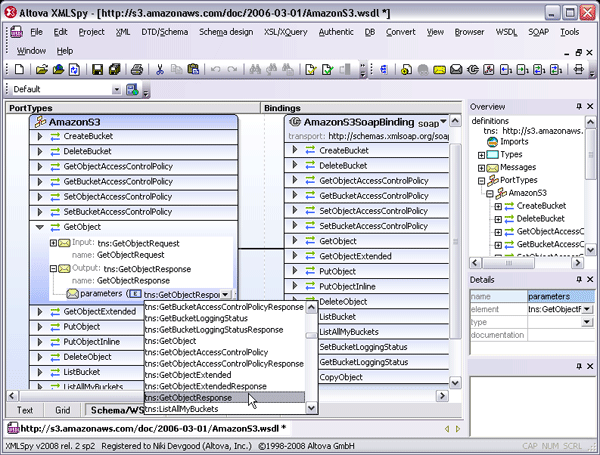 XMLSpy’s WSDL editor gives developers a sophisticated environment for rapid Web services development, managing WSDL syntax and validation through an intuitive, drag and drop graphical interface. The addition of a documentation generation feature makes it possible to share the complete details of a Web service interface with non-technical stakeholders in HTML or Microsoft Word.
SOAP Client
SOAP requests can be manually created in XMLSpy’s SOAP client based on the operations defined in the WSDL. Once an operation is selected, XMLSpy initiates the request based on the connections provided in the WSDL and displays the XML syntax of the SOAP envelope in the main window. The message can then be sent directly to the server for an immediate response. 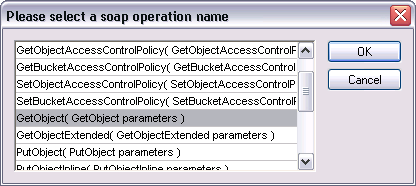
SOAP Debugger
XMLSpy also includes a SOAP debugger, which acts as Web services proxy between client and server, enabling developers to analyze WSDL files and their SOAP message components, single-step through transactions, set breakpoints on SOAP functions, and even define conditional breakpoints that are triggered by a stated XPath query. 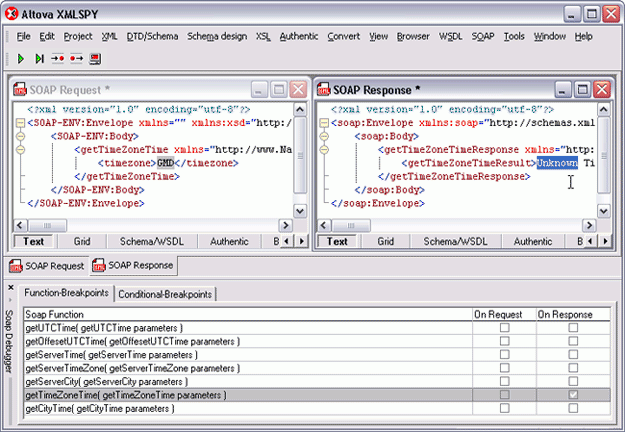
Building Web Services
Once a WSDL definition is complete, it can also be visually implemented using MapForce, Altova’s any-to-any data integration tool. MapForce gives users the ability to map data to or from WSDL operations and then autogenerate program code in Java or C#. Tight integration with Visual Studio and Eclipse makes it possible to then compile the code within either of these IDEs and deploy the service on the client machine. When you create a new Web service project by specifying a Web services definition file (WSDL), MapForce automatically generates mapping files for each individual SOAP operation. 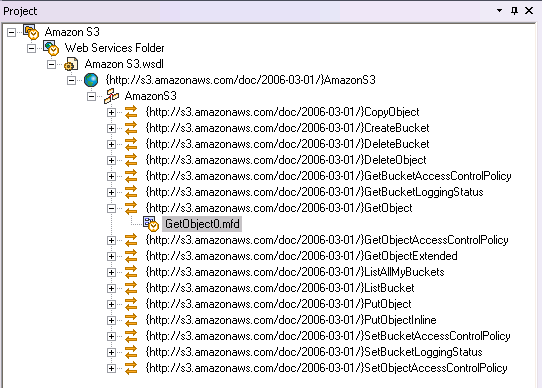 The SOAP input and output messages can then be easily mapped to other source data components (XML, databases, flat files, EDI, XBRL, Excel 2007) to create a complete Web services operation. Data processing functions, filters, and constants can also be inserted to convert the data on the fly.
 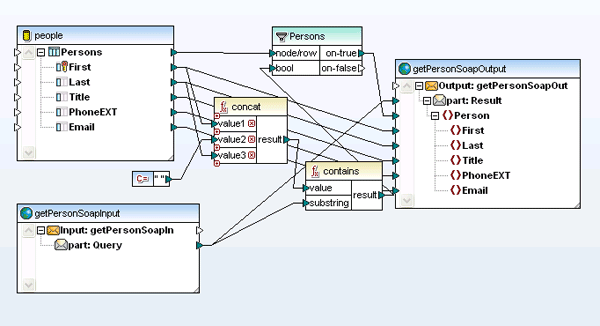 MapForce can autogenerate Web services implementation code in Java or C# for server-side implementation, and it is also accessible for automation via the command line.
File Relationship Management
For complex Web-based applications that include a large number of disparate files and project stakeholders, the MissionKit offers an advanced graphical XML file relationship management tool in SchemaAgent. SchemaAgent can analyze and manage relationships among XML Schemas, XML instance documents (SOAP), WSDL, and XSLT files. The client/server option enables any changes to be visualized in real time across a workgroup. 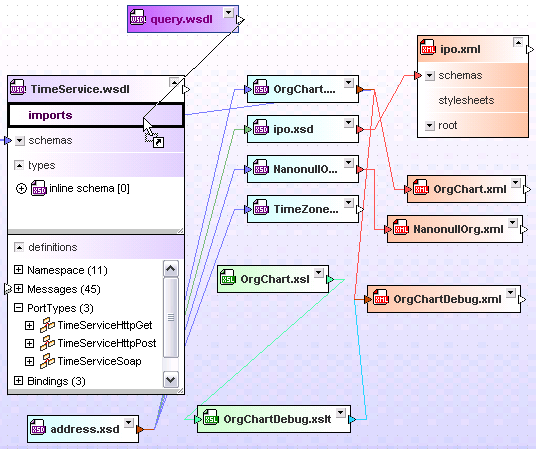 This gives organizations the ability to track and manage their mission critical SOA files as reusable individual components, reducing development time and the occurrence of errors.
Data Integration
A key factor of any SOA is the ability for disparate systems to communicate seamlessly via automated processes. As an any-to-any graphical data integration and Web services implementation tool, MapForce facilitates this undertaking with support for a wide variety of data formats including XML, databases, flat files (which can be easily parsed for integration with legacy systems with the help of the unique FlexText™ utility), EDI, XBRL, Excel 2007, and Web services. 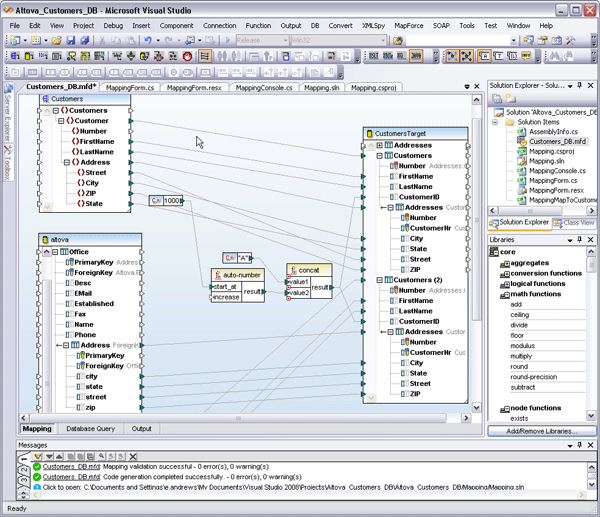 MapForce supports complex data mapping scenarios with multiple sources and targets and advanced data processing functions. Transformations can easily be automated via code generation in C#, C++, or Java, or the command line. Full integration with Visual Studio and Eclipse also makes this an ideal development tool for working in large-scale enterprise projects – without the heavy price tag. This gives developers a flexible and agile middleware component that can work in virtually any service-based architecture. The ability to integrate disparate data in on-the-fly is a key requirement in real-world enterprise and cross-enterprise systems where legacy systems and other less flexible formats co-exist with XML and other modern, interoperable standards.
Database Management
Even in the rapidly evolving semantics-driven macrocosm that is Web 2.0, most companies still use one or more relational databases to store and manage their internal data assets. The Altova MissionKit supports working with the most prevalent of these systems (see listing below) in a wide variety of different ways. Database support is offered in XMLSpy, MapForce, StyleVision, and, of course, DatabaseSpy.
- Microsoft® SQL Server® 2000, 2005, 2008
- IBM DB2® 8, 9
- IBM DB2 for iSeries® v5.4
- IBM DB2 for zSeries® 8, 9
- Oracle® 9i, 10g, 11g
- Sybase® 12
- MySQL® 4, 5
- PostgreSQL 8
- Microsoft Access™ 2003, 2007
DatabaseSpy is a multi-database query, editing, design, and comparison tool that allows users to connect directly to all major databases and edit data and design structure in a graphical user interface with features like table browsing, data editing, SQL auto-completion entry helpers, visual table design, content diff/merging, and multiple export formats. In a service-based architecture, the ability to compare and merge data directly in its native database format is an enormous asset to developers who need to locate changes, migrate differences, or synchronize versions of database tables across test and live environments. 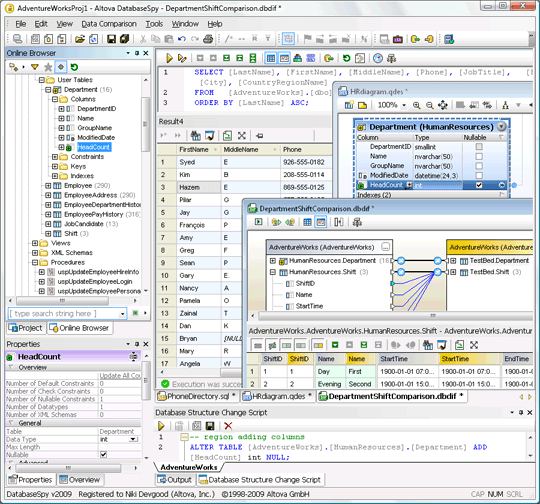 As a component of the MissionKit, DatabaseSpy gives disparate groups within organizations the flexibility to work with data from multiple databases in one central interface simultaneously. Whether this data is eventually integrated into other systems or applications or lives permanently in the database, DatabaseSpy provides a simple and flexible solution to managing and maintaining massive data stores.
Single Source Publishing
In today’s world of highly automated data transfer and management, it is still necessary for human readers to ultimately consume the data in some format or other. Of course, the problem that organizations often run into is what format to publish to. XML and single source publishing have revolutionized content management, document exchange, and even multilingual communications by separating content structure from appearance. An XML-based documentation system can greatly reduce costs through facilitating ease of conversion for delivery to many different data formats and types of applications. The single source concept ensures that workflow processes (i.e., conversion, edits, etc.) do not have to be repeated or reworked – that all content in the repository requires only minimal restructuring and promotion before being loaded to respective applications for delivery. Altova StyleVision is a graphical stylesheet design tool that enables users to easily apply single source publishing to XML, XBRL, and database content, without having any affect on the source data. In this way, companies can create reusable template designs for data that can then be rendered automatically in HTML, RTF, PDF, Microsoft Word 2007, and even an Authentic e-Form for immediate publication to any conceivable medium without any process disruption – resulting in the presentation of accurate, consistent, and standardized information in real-time. 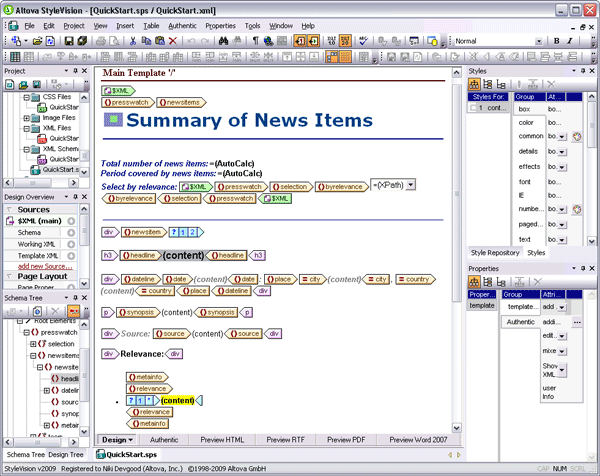 Single source publishing gives organizations the ability to add a human component to their highly automated data processing workflows, enabling them to view transmission reports at any stage. For example, in a world where compliance management plays such a large role in day to day enterprise operations, StyleVision can be integrated into any SOA to provide a sort of visual audit trail for manually reviewing XML, XBRL, and database transactions. StyleVision’s template-based approach to stylesheet design makes it an ideal addition to a distributed development environment, where repeatable processes are an integral part of the system’s overall efficiency.
Conclusions
Financial downturns can make investing in technology a difficult decision. However, forward-thinking organizations will find that focusing on restructuring the legacy assets they already have in place, automating internal processes, and adding virtualization layer to their application infrastructure can lead to increases in efficiency, speed, and potentially enormous ROI. The Altova MissionKit gives businesses all of the tools that they need to augment their enterprise architecture with iterative, process-driven solutions that will recover costs through the reuse of current assets and the ability to deliver Web-driven automation within and across organizations on a global scale. The MissionKit is a highly affordable solution that offers developers, software architects, and IT users all of the tools they need to build flexible and powerful technology solutions and efficiencies that advance component-based service-oriented infrastructure – without breaking the budget.


 Secondly, we were headed mostly west, following the river downstream, but the track shows a predominantly uphill trend.


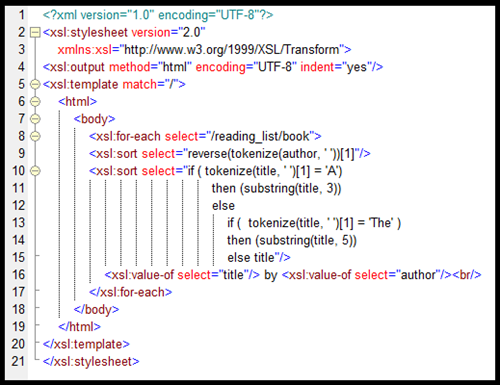 Let’s take a look at how we created this XSLT code.


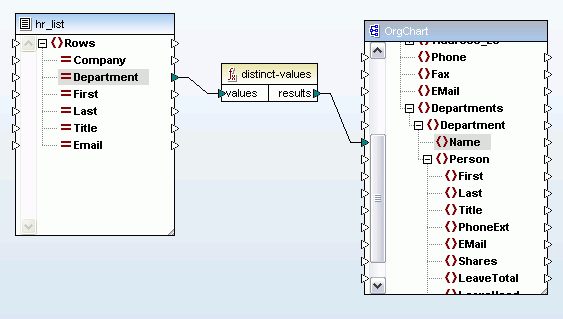 MapForce also now includes a predicated position function that lets you filter out data based on its context position in the input document. For example, the mapping below will return data for only the first two people listed in the source document.
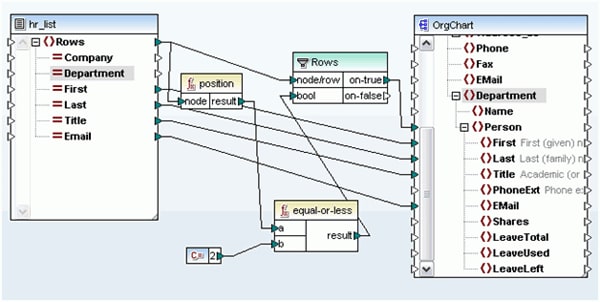
 Ahhh… much easier!! Take a look at the full list of
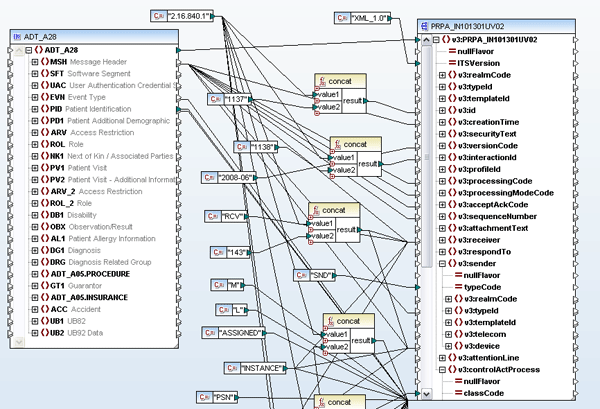
 Fitz and Floyd is a leader in design and manufacture of hand painted ceramic gift ware. In 2007, they approached
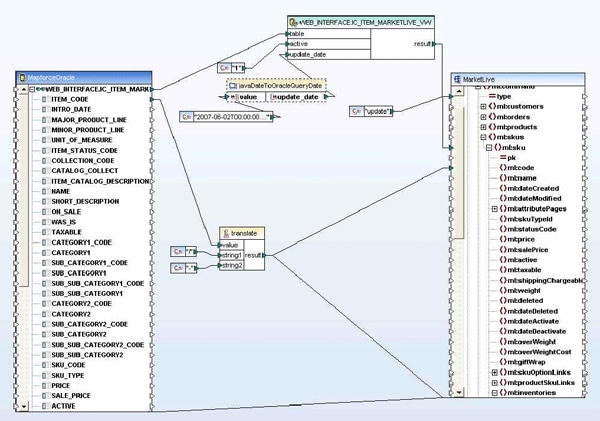
 In order to map to some XML Schema entities that were not explicitly defined in the original MarketLive schema, Wrycan used Altova XMLSpy’s
 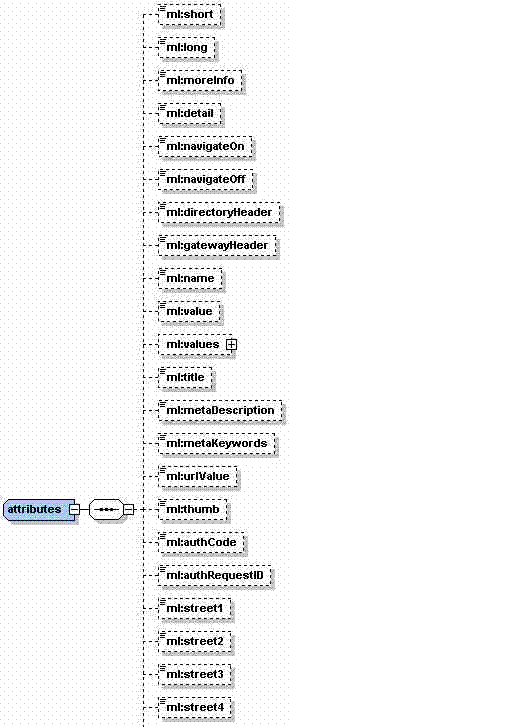 Wrycan used MapForce’s unique code generation capabilities to automatically produce a Java applet that was used to update Fitz and Floyd’s product, inventory, shipping, and order status information programmatically. This specialized applet was then packaged along with Wrycan’s proprietary Transaction Manager. MapForce made it very easy to update and redeploy the data mapping requirements as they changed throughout the project. Because of MapForce’s ease of use and built-in code-generation capabilities, less technical users can also update the data mapping when there are changes.
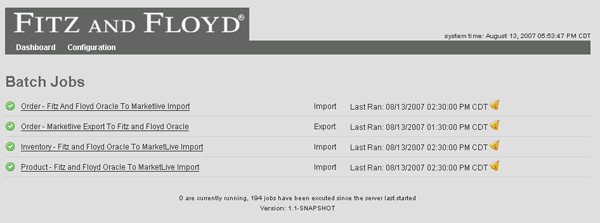 The reporting component allows the result of each transaction to be logged in XML. Because of this, if any transaction errors occurred, Wrycan was able to use
 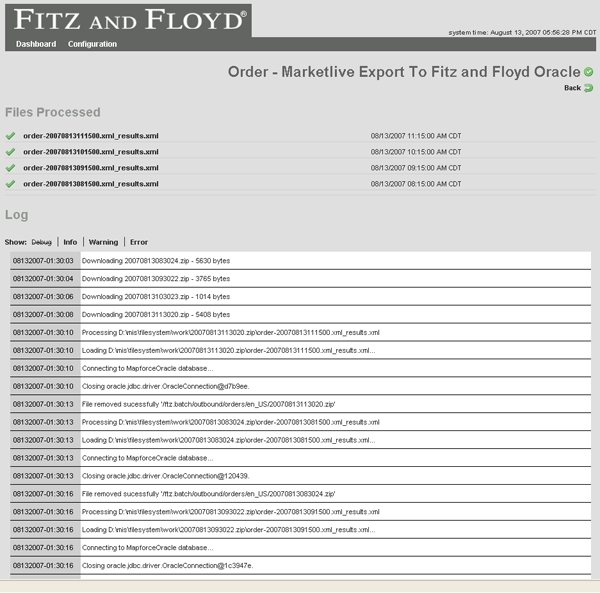 Because the Transaction Manager application is based on platform-independent Java code (generated by MapForce), Wrycan also has a reusable application that can be used as an asset by any online retail company. Wrycan is now able to approach potential clients with a proven data integration layer product that provides job scheduling, email notification, and FTP integration and can utilize any database or schema output via a custom Altova MapForce transformation. When speaking about this project, Dan Ochs, the principal consultant at Wrycan involved with the Fitz and Floyd application stated “MapForce has proven to be an easy-to-use, effective tool for making the data integration and mapping process much easier and faster to implement.” This and many other customer